

Dogecoin's decline to $0.17152 suggests a bearish trend, with $0.16801 serving as a crucial support level. Historical trends indicate a potential rebound if buyers maintain their position above this support. Analysts monitor price and volume fluctuations to determine the overall trend.
Dogecoinの0.17152ドルへの減少は、0.16801ドルが重要なサポートレベルとして機能する弱気の傾向を示唆しています。 歴史的な傾向は、バイヤーがこのサポートより上に自分の立場を維持している場合、潜在的なリバウンドを示しています。 アナリストは価格と量の変動を監視して、全体的な傾向を決定します。
Since its peak of $0.45 in December 2024, Dogecoin has experienced a gradual decline, reaching $0.17152 as of March 17, 2025. This downtrend, marked by lower highs and lows, has established $0.16801 as a key support level, previously acting as resistance in mid-2024.
2024年12月の0.45ドルのピーク以来、Dogecoinは徐々に減少し、2025年3月17日現在0.17152ドルに達しました。
Market Trends and Price Activity
市場の動向と価格活動
Dogecoin's price action in 2024 initially exhibited a period of consolidation, characterized by minimal price fluctuations from May to October. This period of stability ended with a rapid price surge to its December peak, followed by a sharp decline in early 2025.
2024年のDogeCoinの価格アクションは、最初は5月から10月までの最小限の価格変動を特徴とする統合期間を示しました。この安定性の期間は、12月のピークまで急速な価格の急増で終わり、2025年初頭に急激に減少しました。
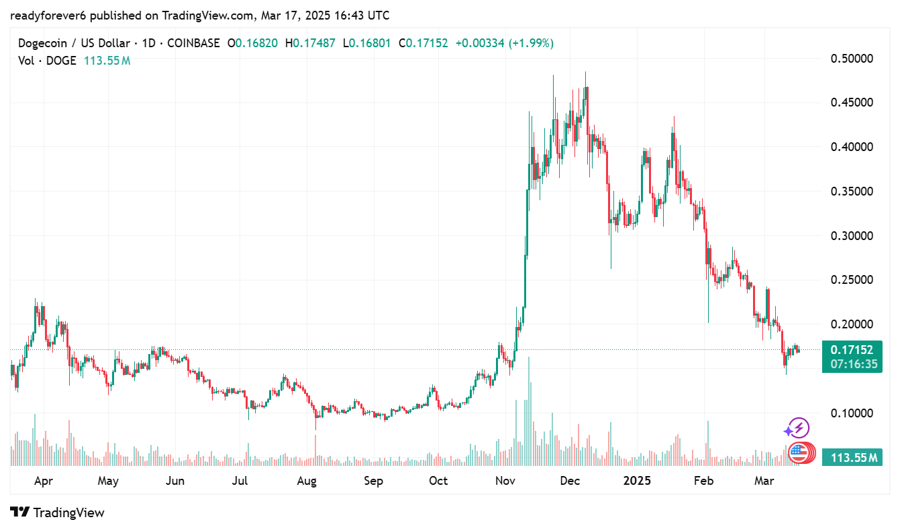
Source: TradingView
出典:TradingView
Long lower wicks in recent candlestick patterns suggest significant buying interest near current levels. Holding the $0.16801 support level could lead to stabilization and a return to buyer control. Conversely, a breach below this level could trigger further losses and extend the bearish trend.
最近のろうそく足のパターンの長い下の芯は、現在のレベルに近いかなりの購入利子を示唆しています。 0.16801ドルのサポートレベルを保持すると、安定化とバイヤーコントロールへの復帰につながる可能性があります。 逆に、このレベル以下の違反は、さらなる損失を引き起こし、弱気の傾向を拡大する可能性があります。
This market behavior mirrors previous cycles where strong support zones have facilitated price reversals. Analysts believe sustained buying pressure at current levels could initiate a recovery. A break above resistance levels could signal a return to bullish momentum in the coming weeks.
この市場行動は、強力なサポートゾーンが価格の逆転を促進した以前のサイクルを反映しています。 アナリストは、現在のレベルでの持続的な購入圧力が回復を開始できると考えています。 抵抗レベルを超えるブレークは、今後数週間で強気の勢いへの復帰を示す可能性があります。
Historical Patterns and Potential Reversal
歴史的パターンと潜在的な逆転
DogecoinCapital's analysis of long-term price movements (2014-2025) using Heikin Ashi candlesticks revealed recurring cycles of accumulation, breakout, and retracement within an ascending price channel. Historically, declines have been followed by recoveries.
Heikin Ashi Candlesticksを使用したDogecoincapitalの長期的な価格運動の分析(2014-2025)は、昇順の価格チャネル内での蓄積、ブレイクアウト、および後退の繰り返しサイクルを明らかにしました。 歴史的に、減少に続いて回復が続きました。
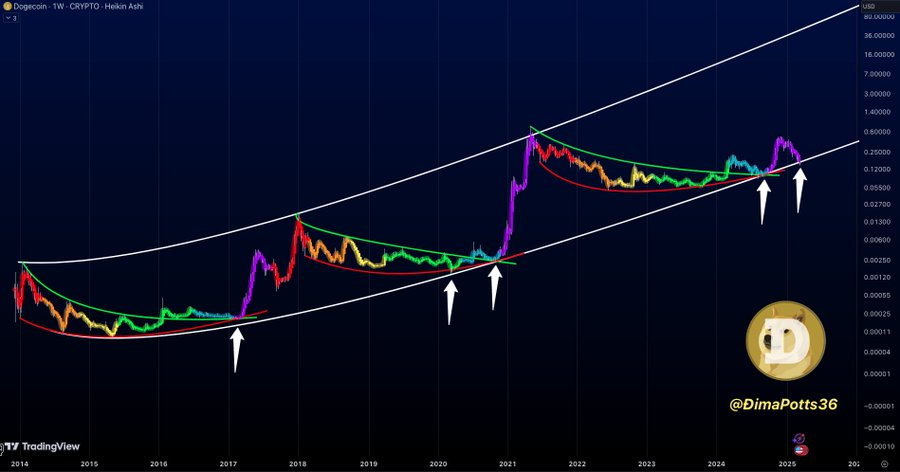
Source: DOGECAPITAL
出典:DogeCapital
DogecoinCapital's analysis indicates that accumulation at the channel's lower boundary frequently precedes significant price increases. The current price action resembles previous accumulation phases, hinting at a potential rebound if demand increases.
Dogecoincapitalの分析は、チャネルの下限での蓄積が頻繁に大幅な価格上昇に先行することを示しています。 現在の価格アクションは、以前の蓄積段階に似ており、需要が増加すると潜在的なリバウンドを示唆しています。
However, failure to maintain the $0.16801 support level could prolong the downturn. Analysts are closely monitoring trading volume and technical indicators to assess buyer commitment at critical support levels. The market's trajectory hinges on Dogecoin's ability to maintain key support or succumb to further price declines.
ただし、0.16801ドルのサポートレベルを維持できないと、景気後退が長くなる可能性があります。 アナリストは、取引量と技術指標を綿密に監視して、重要なサポートレベルでの買い手のコミットメントを評価しています。 市場の軌跡は、主要なサポートを維持したり、さらなる価格の下落に屈することを維持するDogecoinの能力にかかっています。
 BlockchainReporter
 Cryptopolitan_News
 Cryptos Newss
 DogeHome
 CFN
CFN Optimisus


