

Dogecoin Long-Term Holders in Denial? A Look at NUPL and Price Patterns
多霉素长期拒绝? 看看NUPL和价格模式
The Net Unrealized Profit/Loss (NUPL) metric for long-term Dogecoin (DOGE) holders suggests a state of denial among investors as their unrealized profits dwindle.
长期Dogecoin(Doge)持有人的净未实现的损益/损失(NUPL)度量表明,投资者的否认状态是他们未实现的利润减少了。
Early December saw DOGE holders exhibiting euphoria, reflecting high unrealized profits and strong market sentiment. By mid-December, however, this shifted to a "belief" phase, indicating continued confidence despite declining prices.
12月初,道门人持有者展现出欣喜若狂,反映了未实现的高利润和强烈的市场情绪。 然而,到12月中旬,这已经转变为“信仰”阶段,表明尽管价格下降,但仍在持续信心。
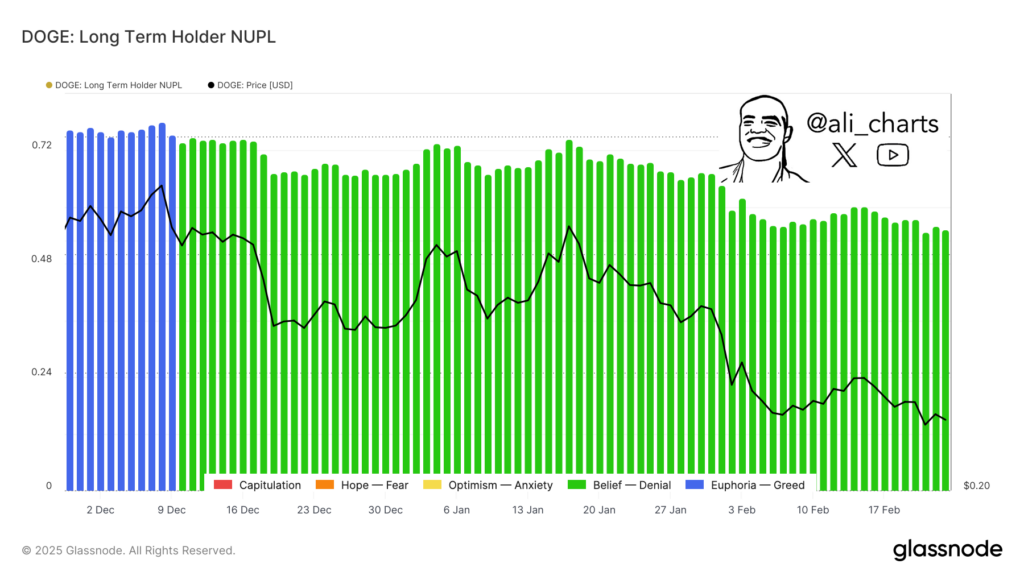
DOGE Long Term Holder NUPL | Source: Glassnode
Doge长期持有人nupl |来源:玻璃节
A sharp DOGE price drop in late December coincided with a NUPL decrease from above 0.72 to nearly 0.48. Throughout January and February, the NUPL remained within the "belief" zone, even with the downward price trend. This persistence suggests holders anticipate a price recovery, a hallmark of the denial phase in market cycles. Continued downward pressure could lead to fear, capitulation, and ultimately, panic selling. Conversely, increased demand and price stabilization could reignite optimism and a return to the "belief" phase, signifying market resilience.
12月下旬的急剧下降的总督价格与NUPL从0.72降至近0.48降低。 在整个1月和2月,NUPL仍然在“信念”区域内,即使价格下降的趋势也是如此。这种持久性表明,持有人预计价格恢复是市场周期中拒绝阶段的标志。 继续向下压力会导致恐惧,投降,并最终导致恐慌销售。相反,增加的需求和价格稳定可能会重新点燃乐观,并回到“信念”阶段,这表明市场的韧性。
Dogecoin Mirroring Past Performance?
多霉素反映过去的表现?
Analysis reveals a potential parallel between Dogecoin's current price action and its 2017-2018 bull run. This earlier period featured a large descending triangle (2015-2017), followed by a significant breakout rally. The price consolidated within this pattern before a parabolic surge. Similarly, DOGE appears to be forming a comparable pattern between 2021 and 2025, characterized by a descending triangle, lower highs, and compressed price action.
分析表明,Dogecoin目前的价格行动与其2017-2018 Bull Run之间的潜在相似之处。 早期的时期有一个大型下降三角(2015-2017),随后进行了重大突破集。 在抛物线电涌之前,价格在此模式中合并。 同样,Doge似乎在2021年至2025年之间形成了可比的模式,其特征是下降三角形,较低的高点和压缩的价格动作。
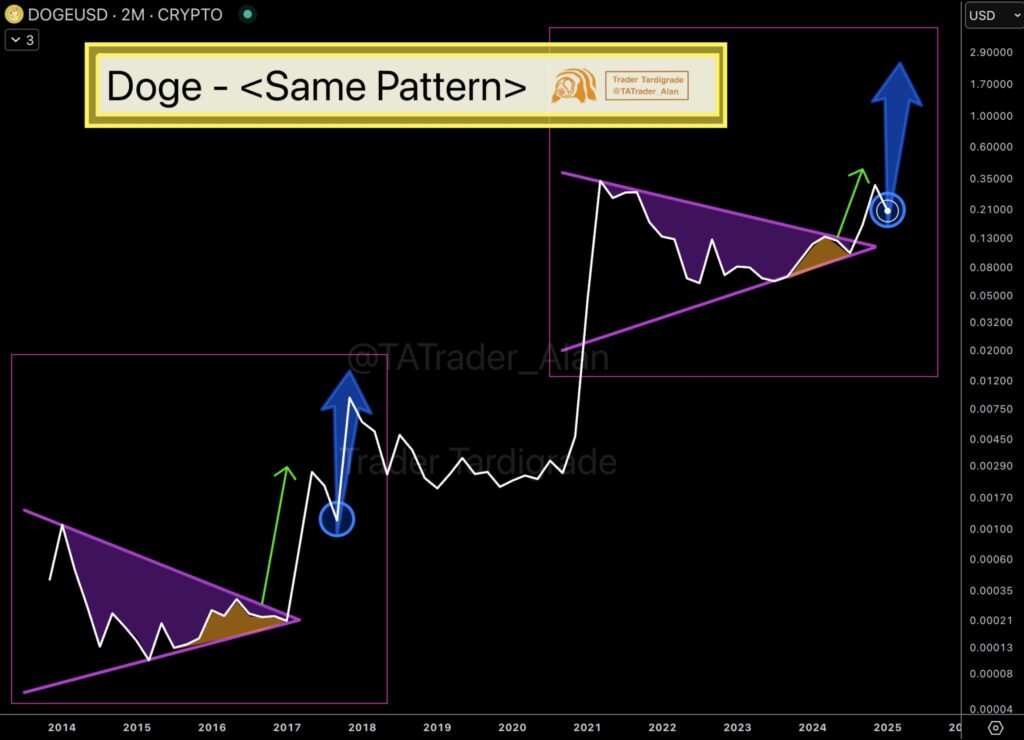
Source: Trader Tardigrade/X
资料来源:Trader Tardigrade/X
The 2017 breakout propelled DOGE from approximately $0.0003 to over $0.01—a 3,000% increase. If history repeats, DOGE could move from its current $0.08-$0.50 range to above $0.70 or even $1.00. The current price action shows compression and accumulation, echoing the 2017 structure. A similar trajectory could result in a substantial rally, potentially exceeding $1.00 in the next cycle. However, failure to break out could lead to extended consolidation, delaying any significant bullish movement. The upcoming price action is therefore crucial.
2017年的分手从大约0.0003美元推进了大约$ 0.01,增长了3,000%。 如果有历史记录重复,Doge可能会从目前的$ 0.08- $ 0.50范围转移到高于$ 0.70甚至$ 1.00的范围。 当前的价格动作显示压缩和积累,与2017年结构相呼应。 类似的轨迹可能会导致大量集会,在下一个周期中可能超过$ 1.00。 但是,未能突破可能会导致扩展的合并,从而延迟任何重大的看涨运动。 因此,即将进行的价格行动至关重要。
Dogecoin's Monthly Trend and Key Price Levels
Dogecoin的每月趋势和关键价格水平
The monthly chart displays a clear uptrend as long as DOGE remains within its rising channel. This structure mirrors previous 50-bar cycles, each concluding with a major breakout. Historically, DOGE experienced significant surges after these consolidation periods, as seen in January 2018 and May 2021.
每月图表显示出明显的上升趋势,只要Doge仍在其上升渠道内。 该结构反映了以前的50杆循环,每个循环都以重大突破结论。 从历史上看,在2018年1月和2021年5月,Doge在这些合并期间经历了巨大的潮流。
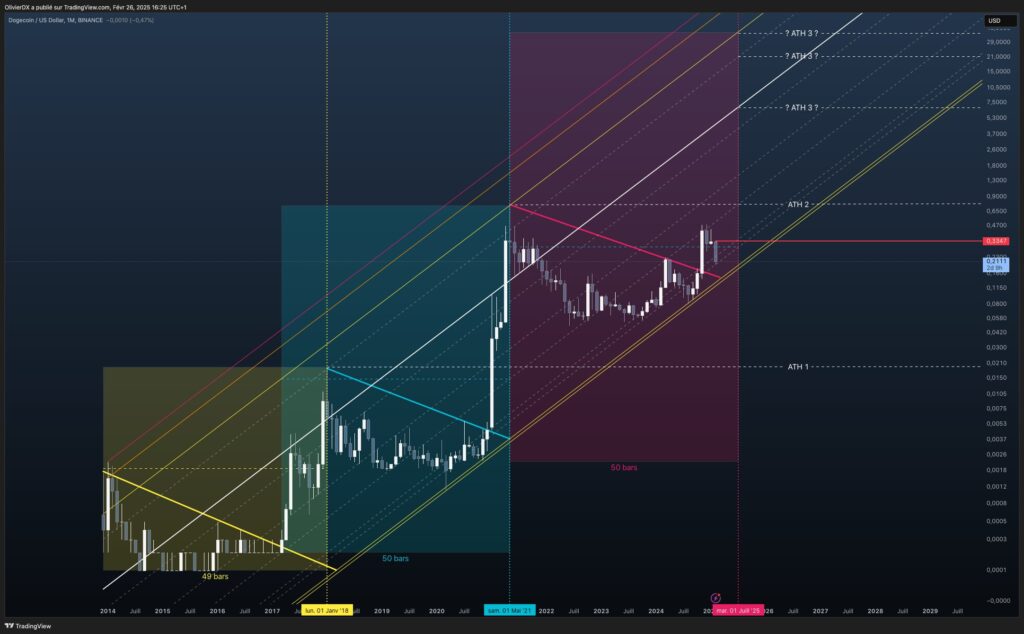
Source: TradingView
资料来源:TradingView
Currently trading at $0.3347, just below the $0.3350 resistance level, DOGE's next move hinges on breaking and holding above this key level. A successful breakout could target $0.4700, $0.9650, and potentially $2.10. Further extension, mirroring past performance, could lead to a long-term move towards $5.00 or higher. Failure to maintain momentum within the channel could result in a retest of the $0.1150 support level, with a potential further decline to $0.0420. However, based on historical patterns, a substantial surge is anticipated, with $0.3350 serving as a crucial pivot point.
目前,交易价格为0.3347美元,低于0.3350的阻力水平,Doge的下一步行动取决于打破并保持在此关键水平以上。 成功的突破可能针对$ 0.4700,$ 0.9650和可能为2.10美元。 进一步的延伸,反映过去的性能,可能会导致长期转向$ 5.00或更高。 无法在渠道内保持动力可能会导致重新测试0.1150的支持水平,并有可能进一步下降至0.0420美元。 但是,基于历史模式,预计会有大量激增,其中0.3350美元作为关键枢轴点。
 BlockchainReporter
 BlockchainReporter
 DogeHome
 Cryptopolitan_News
 U_Today
 BlockchainReporter
 DogeHome
 BlockchainReporter
 TheNewsCrypto


