

Dogecoin Long-Term Holders in Denial? A Look at NUPL and Price Patterns
Dogecoinの長期保有者は否定しますか? Nuplと価格のパターンを見てください
The Net Unrealized Profit/Loss (NUPL) metric for long-term Dogecoin (DOGE) holders suggests a state of denial among investors as their unrealized profits dwindle.
長期のDogecoin(DOGE)保有者の純未実現の利益/損失(NUPL)メトリックは、未実現の利益が減少するため、投資家の間で否定の状態を示唆しています。
Early December saw DOGE holders exhibiting euphoria, reflecting high unrealized profits and strong market sentiment. By mid-December, however, this shifted to a "belief" phase, indicating continued confidence despite declining prices.
12月上旬には、ドージホルダーが陶酔感を示し、高くない利益と強力な市場感情を反映していました。 しかし、12月中旬までに、これは「信念」段階に移行し、価格が低下したにもかかわらず継続的な信頼を示しています。
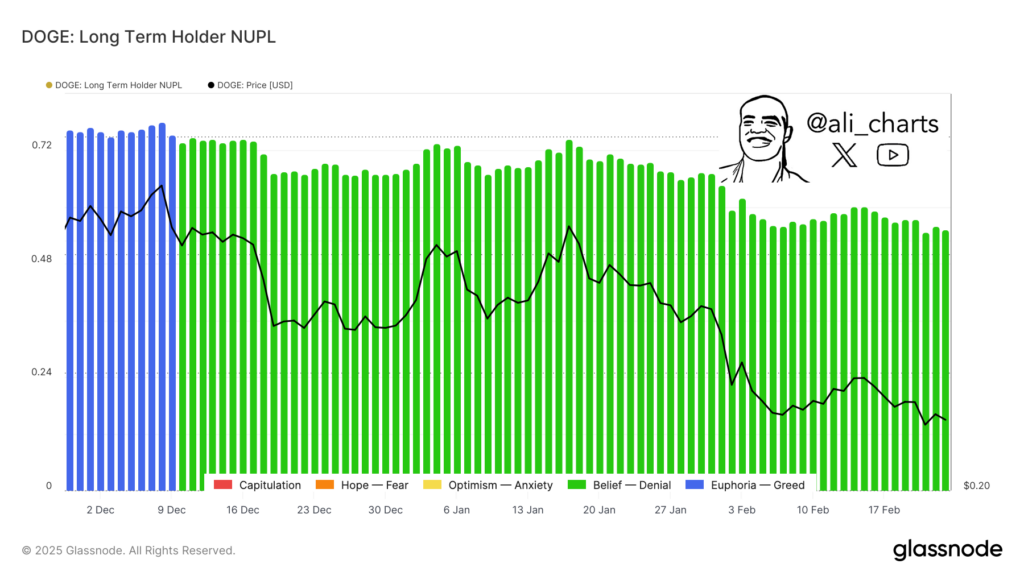
DOGE Long Term Holder NUPL | Source: Glassnode
Doge長期保有者nupl |出典:GlassNode
A sharp DOGE price drop in late December coincided with a NUPL decrease from above 0.72 to nearly 0.48. Throughout January and February, the NUPL remained within the "belief" zone, even with the downward price trend. This persistence suggests holders anticipate a price recovery, a hallmark of the denial phase in market cycles. Continued downward pressure could lead to fear, capitulation, and ultimately, panic selling. Conversely, increased demand and price stabilization could reignite optimism and a return to the "belief" phase, signifying market resilience.
12月下旬のシャープなdogeの価格は、0.72を超えてから0.48近くに減少したことと一致しました。 1月と2月を通して、NUPLは下向きの価格動向であっても、「信念」ゾーン内にとどまりました。この持続性は、保有者が価格回復、つまり市場サイクルの拒否段階の特徴を予測することを示唆しています。 継続的な下向きの圧力は、恐怖、降伏、そして最終的にはパニックの販売につながる可能性があります。逆に、需要と価格の安定化の増加は、楽観主義と「信念」段階への復帰を再燃させる可能性があり、市場の回復力を意味します。
Dogecoin Mirroring Past Performance?
Dogecoinミラーリングの過去のパフォーマンス?
Analysis reveals a potential parallel between Dogecoin's current price action and its 2017-2018 bull run. This earlier period featured a large descending triangle (2015-2017), followed by a significant breakout rally. The price consolidated within this pattern before a parabolic surge. Similarly, DOGE appears to be forming a comparable pattern between 2021 and 2025, characterized by a descending triangle, lower highs, and compressed price action.
分析により、Dogecoinの現在の価格アクションと2017-2018 Bull Runの潜在的な類似点が明らかになりました。 この初期の期間は、大きな降順の三角形(2015-2017)を特徴とし、その後に大きなブレイクアウトラリーが続きました。 放物線の急増の前にこのパターン内で統合された価格。 同様に、Dogeは2021年から2025年の間に同等のパターンを形成しているように見えます。
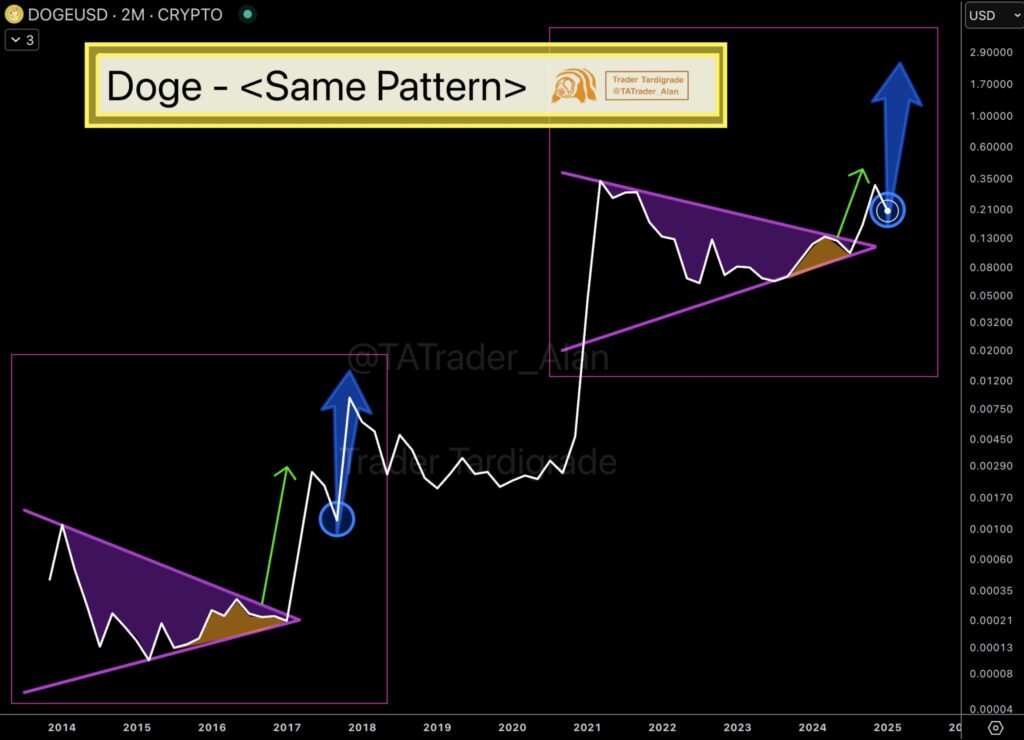
Source: Trader Tardigrade/X
出典:Trader Tardigrade/x
The 2017 breakout propelled DOGE from approximately $0.0003 to over $0.01—a 3,000% increase. If history repeats, DOGE could move from its current $0.08-$0.50 range to above $0.70 or even $1.00. The current price action shows compression and accumulation, echoing the 2017 structure. A similar trajectory could result in a substantial rally, potentially exceeding $1.00 in the next cycle. However, failure to break out could lead to extended consolidation, delaying any significant bullish movement. The upcoming price action is therefore crucial.
2017年のブレイクアウトにより、Dogeは約0.0003ドルから0.01ドルを超えて3,000%増加しました。 歴史が繰り返されると、Dogeは現在の0.08〜0.50ドルの範囲から0.70ドルを超える、または1.00ドルを超えることができます。 現在の価格アクションは、2017年の構造を反映して圧縮と蓄積を示しています。 同様の軌跡は、次のサイクルで潜在的に1.00ドルを超える可能性のある相当な集会をもたらす可能性があります。 しかし、脱出しないと、統合が延長され、重大な強気運動が遅れる可能性があります。 したがって、今後の価格アクションは重要です。
Dogecoin's Monthly Trend and Key Price Levels
Dogecoinの毎月の傾向と主要な価格レベル
The monthly chart displays a clear uptrend as long as DOGE remains within its rising channel. This structure mirrors previous 50-bar cycles, each concluding with a major breakout. Historically, DOGE experienced significant surges after these consolidation periods, as seen in January 2018 and May 2021.
毎月のチャートには、Dogeが上昇するチャネル内に残っている限り、明確なアップトレンドを表示します。 この構造は、以前の50バーサイクルを反映しており、それぞれが大きなブレイクアウトで終わります。 歴史的に、Dogeは、2018年1月と2021年5月に見られるように、これらの統合期間後に重大な急増を経験しました。
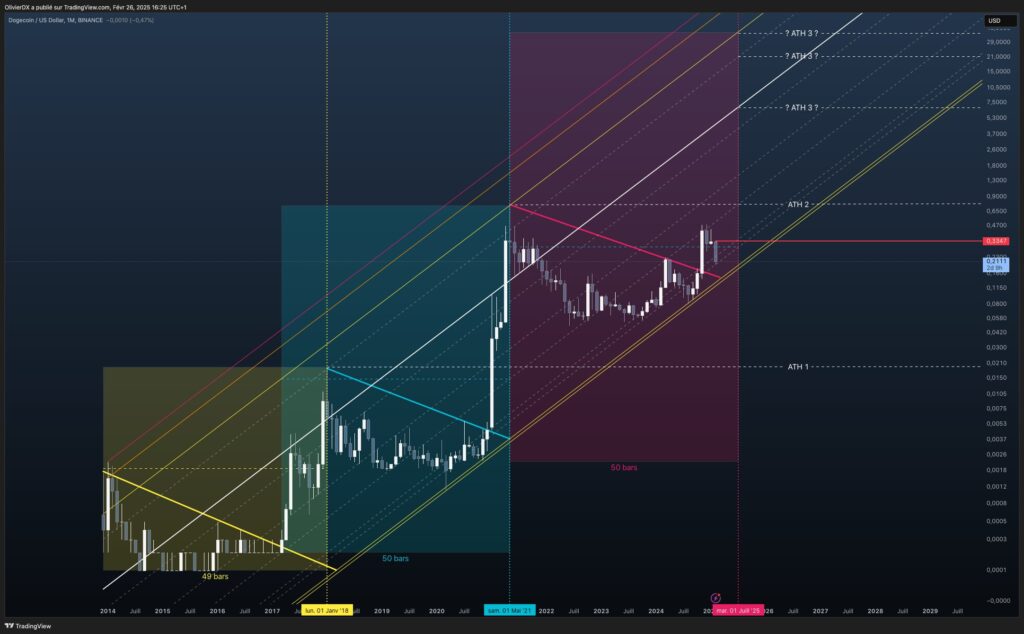
Source: TradingView
出典:TradingView
Currently trading at $0.3347, just below the $0.3350 resistance level, DOGE's next move hinges on breaking and holding above this key level. A successful breakout could target $0.4700, $0.9650, and potentially $2.10. Further extension, mirroring past performance, could lead to a long-term move towards $5.00 or higher. Failure to maintain momentum within the channel could result in a retest of the $0.1150 support level, with a potential further decline to $0.0420. However, based on historical patterns, a substantial surge is anticipated, with $0.3350 serving as a crucial pivot point.
現在、0.3347ドルの抵抗レベルのすぐ下にある0.3347ドルで取引されているDogeの次の動きは、このキーレベルを超えて保持することにかかっています。 ブレイクアウトが成功すると、0.4700ドル、0.9650ドル、潜在的に2.10ドルをターゲットにすることができます。 過去のパフォーマンスをミラーリングするさらなる拡張は、5.00ドル以上に向けて長期的な動きにつながる可能性があります。 チャネル内で勢いを維持できないと、0.1150ドルのサポートレベルが再テストされ、さらに0.0420ドルに減少する可能性があります。 ただし、歴史的なパターンに基づいて、かなりの急増が予想され、0.3350ドルが重要なピボットポイントとして機能します。
 DogeHome
 BlockchainReporter
 BlockchainReporter
 DogeHome
 Cryptopolitan_News
 U_Today
 BlockchainReporter
 BlockchainReporter


