

Dogecoin Price Rises Amidst SEC ETF Approval Buzz
Dogecoin价格在SEC ETF批准嗡嗡声中上涨
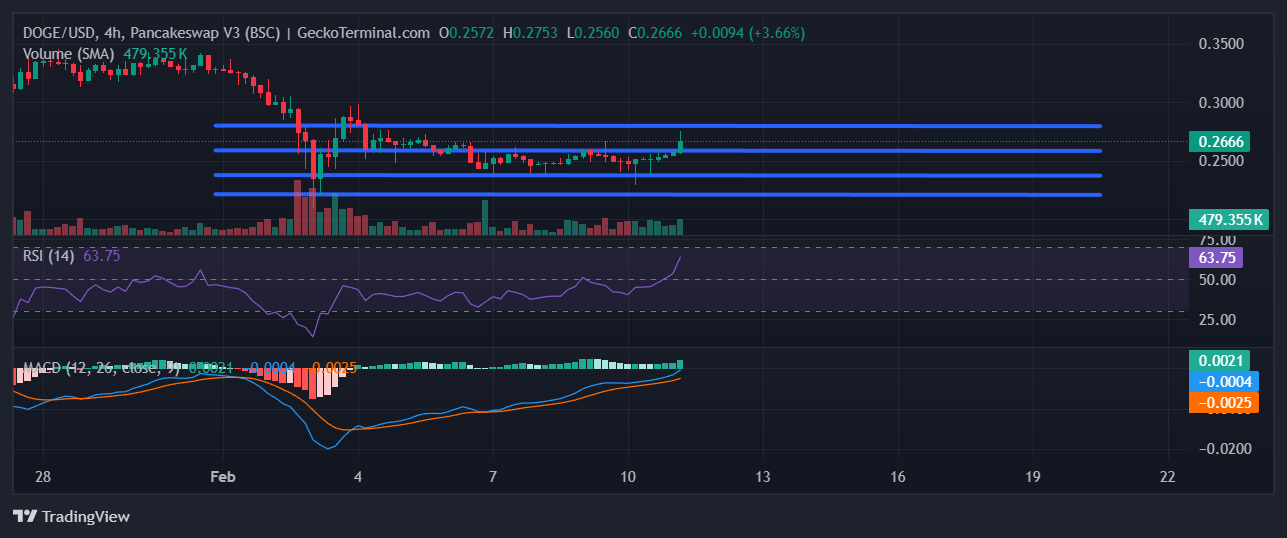
The Dogecoin (DOGE) price surged over 5% within the past 24 hours, reaching $0.2665 as of 3:10 a.m. EST. This upward trend is driven by increased investor interest in the popular meme coin.
在过去的24小时内,Dogecoin(Doge)的价格飙升了5%以上,截至美国东部时间上午3:10 $ 0.2665。这种向上的趋势是由投资者对流行的模因硬币的提高驱动的。
Bloomberg ETF analysts James Seyffart and Eric Balchunas recently predicted a 75% likelihood of the US Securities and Exchange Commission (SEC) approving a spot Dogecoin ETF this year. Additionally, they anticipate the SEC acknowledging filings for Dogecoin ETFs from Grayscale and Bitwise this week.
彭博ETF分析师James Seyffart和Eric Balchunas最近预测,美国证券交易委员会(SEC)批准了今年的Dogecoin ETF的75%。此外,他们预计SEC将承认本周的灰ecoin eTF申请。
Dogecoin Price Targets Resistance Level at $0.2582
Dogecoin价格目标电阻水平为$ 0.2582
According to data from GeckoTerminal, the Dogecoin price is attempting to establish support at the $0.2582 resistance level. A successful 4-hour candle close above this mark could provide the foundation for a challenge towards the next resistance barrier at $0.2789.
根据Geckoterminal的数据,Dogecoin的价格试图以0.2582美元的电阻水平建立支持。超过此商标的成功的4小时蜡烛可以为下一个阻力障碍的挑战为0.2789美元的挑战提供基础。
However, a rejection at $0.2582 or a sell-off could invalidate the bullish momentum. In such a scenario, DOGE may seek support at $0.2353 or potentially dip further to $0.2211.
但是,拒绝为0.2582美元或抛售可能使看涨势头无效。在这种情况下,Doge可能以0.2353美元的价格寻求支持,或者可能会进一步下跌至0.2211美元。
Technical Indicators Suggest Further Upside Potential
技术指标建议进一步的上升潜力
Technical indicators on DOGE's 4-hour chart point towards potential further price gains. The Moving Average Convergence Divergence (MACD) and Relative Strength Index (RSI) exhibit bullish signals.
Doge 4小时图表上的技术指标指向潜在的进一步价格上涨。移动平均收敛差异(MACD)和相对强度指数(RSI)表现出看涨信号。
RSI readings have risen to the mid-60s, indicating growing buyer strength. The positive slope of the RSI suggests continued accumulation by bulls. Additionally, the MACD line has recently broken away above the MACD Signal line, signaling increasing bullish momentum.
RSI读数已经上升至60年代中期,表明买家的实力不断增长。 RSI的正斜率表明公牛继续积累。此外,MACD线最近已在MACD信号线上折断,这会增加看涨的动力。
Related Article:
相关文章:
 U.Today
 BlockchainReporter
 DogeHome
 CFN
CFN Optimisus
 CryptoNewsLand
 Crypto News Land
 TheNewsCrypto


