

Dogecoin Price Rises Amidst SEC ETF Approval Buzz
DogeCoin Priceは、SEC ETF承認の話題の中で上昇します
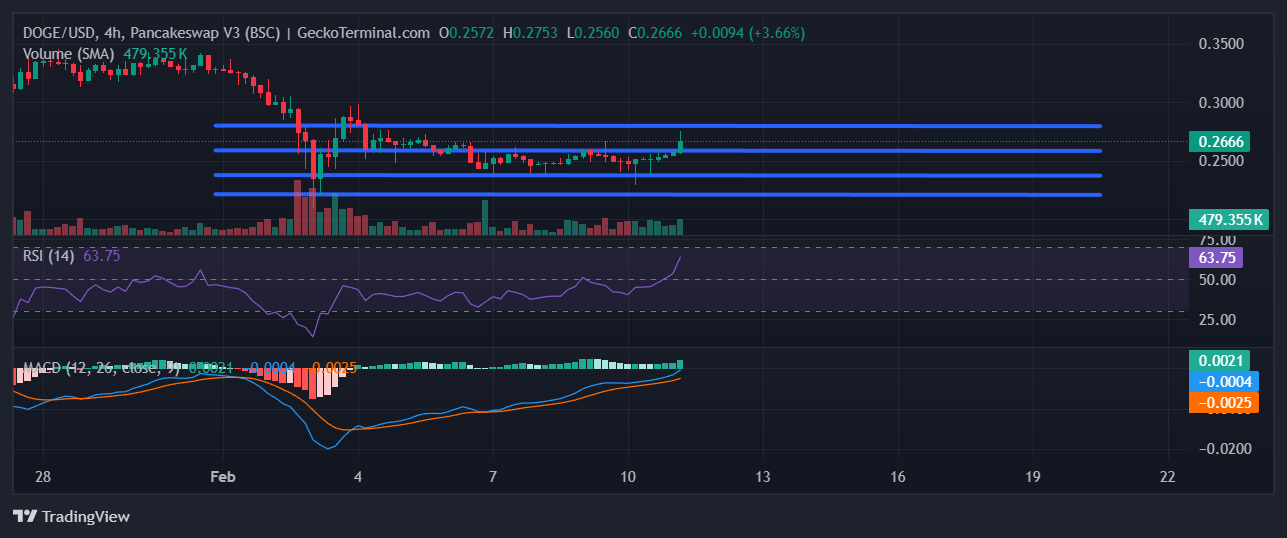
The Dogecoin (DOGE) price surged over 5% within the past 24 hours, reaching $0.2665 as of 3:10 a.m. EST. This upward trend is driven by increased investor interest in the popular meme coin.
Dogecoin(Doge)の価格は過去24時間以内に5%以上急増し、午前3時10分時点で0.2665ドルに達しました。この上昇傾向は、人気のあるミームコインに対する投資家の関心の高まりによって推進されています。
Bloomberg ETF analysts James Seyffart and Eric Balchunas recently predicted a 75% likelihood of the US Securities and Exchange Commission (SEC) approving a spot Dogecoin ETF this year. Additionally, they anticipate the SEC acknowledging filings for Dogecoin ETFs from Grayscale and Bitwise this week.
ブルームバーグETFアナリストのジェームズ・セイファートとエリック・バルチュナスは最近、今年のSpot Dogecoin ETFを承認する米国証券取引委員会(SEC)の75%の可能性を予測しました。さらに、彼らは今週、GrayscaleとBitiseからのDogecoin ETFの申請を認めるSECを予想しています。
Dogecoin Price Targets Resistance Level at $0.2582
Dogecoin Priceは、抵抗レベルを0.2582ドルでターゲットにしています
According to data from GeckoTerminal, the Dogecoin price is attempting to establish support at the $0.2582 resistance level. A successful 4-hour candle close above this mark could provide the foundation for a challenge towards the next resistance barrier at $0.2789.
Geckoterminalのデータによると、Dogecoin Priceは0.2582ドルのレジスタンスレベルでサポートを確立しようとしています。このマークの上に閉じた4時間のキャンドルを成功させると、次の抵抗障壁に対する課題の基礎が0.2789ドルである可能性があります。
However, a rejection at $0.2582 or a sell-off could invalidate the bullish momentum. In such a scenario, DOGE may seek support at $0.2353 or potentially dip further to $0.2211.
ただし、0.2582ドルまたは売却での拒否は、強気の勢いを無効にする可能性があります。このようなシナリオでは、Dogeは0.2353ドルでサポートを求めるか、さらに0.2211ドルに浸る可能性があります。
Technical Indicators Suggest Further Upside Potential
技術的指標は、さらに上向きの可能性を示唆しています
Technical indicators on DOGE's 4-hour chart point towards potential further price gains. The Moving Average Convergence Divergence (MACD) and Relative Strength Index (RSI) exhibit bullish signals.
Dogeの4時間チャートの技術指標は、さらなる価格の潜在的な利益を指します。移動平均収束発散(MACD)および相対強度指数(RSI)は、強気信号を示します。
RSI readings have risen to the mid-60s, indicating growing buyer strength. The positive slope of the RSI suggests continued accumulation by bulls. Additionally, the MACD line has recently broken away above the MACD Signal line, signaling increasing bullish momentum.
RSIの測定値は60年代半ばまで上昇し、買い手の強さの増加を示しています。 RSIの正の勾配は、雄牛による継続的な蓄積を示唆しています。さらに、MACDラインは最近、MACD信号ラインの上に壊れており、強気の勢いが増加しています。
Related Article:
関連記事:
 U.Today
 BlockchainReporter
 DogeHome
 CFN
CFN Optimisus
 CryptoNewsLand
 Crypto News Land
 TheNewsCrypto


