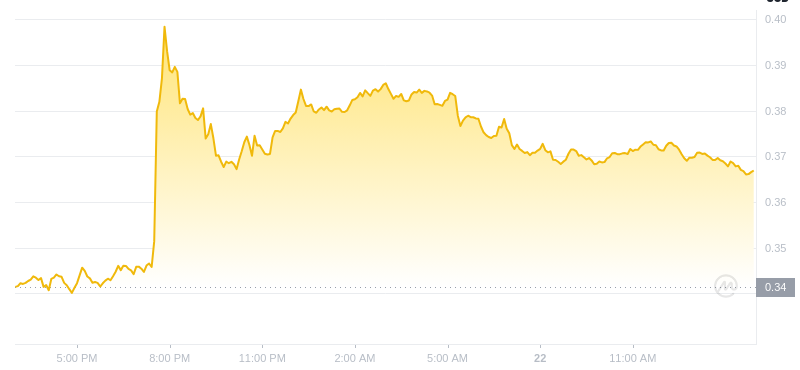
Drawing parallels from historical data, he pointed out that the last instance when Dogecoin engaged with the 1M Parabolic SAR, it skyrocketed with an impressive 24,000% surge.
This observation naturally leads to the speculation: Is Dogecoin gearing up to mirror its previous feats, or is it poised for a more subdued trajectory?
In terms of patterns, the Falling Wedge is predominantly seen as a precursor to a bullish breakout. When the price manages to cross the upper trend line, it’s generally anticipated to move in an upward direction. While some swing traders might be tempted to capitalize on emerging patterns within the converging lines, the general consensus among traders is to exercise patience. It’s often recommended to wait for the pattern to fully materialize and exhibit a breakout before initiating a BUY order.
Assessing the current trend, Dogecoin seems to be on an upward trajectory in the short to medium term. However, when viewed from a long-term perspective, its trend appears to be neutral. The momentum indicators present a mixed bag. The MACD Line’s position below the MACD Signal Line leans towards a bearish sentiment. In contrast, the RSI, which is approximately at 50, indicates neutrality. But there’s a silver lining: the ascending MACD Histogram bars suggest that Dogecoin’s momentum might be on the brink of another upswing.
On the support and resistance front, Dogecoin finds its immediate support at $0.070, which interestingly was a previous resistance point. Following this, the next support level is at $0.055. Conversely, the resistance zones that Dogecoin might encounter are at $0.010 and subsequently at $0.110.
As Dogecoin navigates its way through established support and resistance zones, investors and traders alike should remain vigilant, keeping an eye on key price points and market indicators. The coming days could be pivotal in determining whether Dogecoin will emulate its past glory or chart a different course.
Join us on Facebook and Twitter for the latest insights and discussions in the world of crypto.
Explore our news section and stay ahead of the curve with our expert price predictions.
托尼“公牛”(@tonythebullBTC)是 Twitter 上的一位杰出交易员和技术分析专家,最近深入研究了狗狗币($DOGE)的动态。他与历史数据进行了比较,指出狗狗币与狗狗币进行交易的最后一个例子1M 抛物线转向指标,它以令人印象深刻的 24,000% 飙升。这一观察结果自然引发了猜测:狗狗币是否正在准备复制其之前的壮举,或者是否准备走一个更加温和的轨迹?根据 altFINS 提供的见解,狗狗币最近显示出对下降楔形形态的看涨突破。这种模式通常表明买入压力开始超过卖出压力,暗示趋势可能逆转。当狗狗币的价格不仅突破了 0.07 美元的阻力位,而且还超过了 0.08 美元的 200 日移动平均线时,这种看涨情绪得到了进一步巩固。如果这种势头持续下去,狗狗币下一步可能会把目光投向 0.10 美元的阻力位。 就模式而言,下降楔形主要被视为看涨突破的先兆。当价格成功穿越上方趋势线时,通常预计会向上移动。虽然一些波段交易者可能会试图利用聚合线内的新兴模式,但交易者的普遍共识是保持耐心。通常建议等待该模式完全实现并出现突破,然后再启动买入订单。评估当前趋势,狗狗币在中短期内似乎处于上升轨道。然而,从长期角度来看,其趋势似乎是中性的。动能指标好坏参半。 MACD 线位于 MACD 信号线下方的位置倾向于看跌情绪。相反,RSI 约为 50,表明中性。但也有一线希望:上涨的 MACD 柱状图表明狗狗币的势头可能正处于另一次上涨的边缘。在支撑和阻力方面,狗狗币在 0.070 美元找到了直接支撑,有趣的是,这是之前的阻力点。在此之后,下一个支撑位是 0.055 美元。相反,狗狗币可能遇到的阻力区域为 0.010 美元,随后为 0.110 美元。您可以在此处查看我们的狗狗币价格预测。随着狗狗币穿过既定的支撑和阻力区域,投资者和交易者都应保持警惕,密切关注关键价格点和市场指标。未来几天可能是决定狗狗币是否会效仿其过去的辉煌或制定不同路线的关键。在 Facebook 和 Twitter 上加入我们,了解加密世界的最新见解和讨论。探索我们的新闻部分并保持领先地位我们的专家价格预测。狗狗币交易员押注似曾相识:历史上 24,000% 的狗狗币价格会两次飙升吗?首先出现在 CaptainAltcoin 上。


 CoinPedia News
 DogeHome
 ItsBitcoinWorld
 Cryptopolitan_News
 U_Today
 Cryptopolitan_News
 DT News
 Cryptopolitan_News
 Thecryptoupdates


