Crypto analysts sound the alarm on Dogecoin as a classic chart pattern emerges
随着经典图表模式的出现,加密货币分析师对狗狗币发出警报
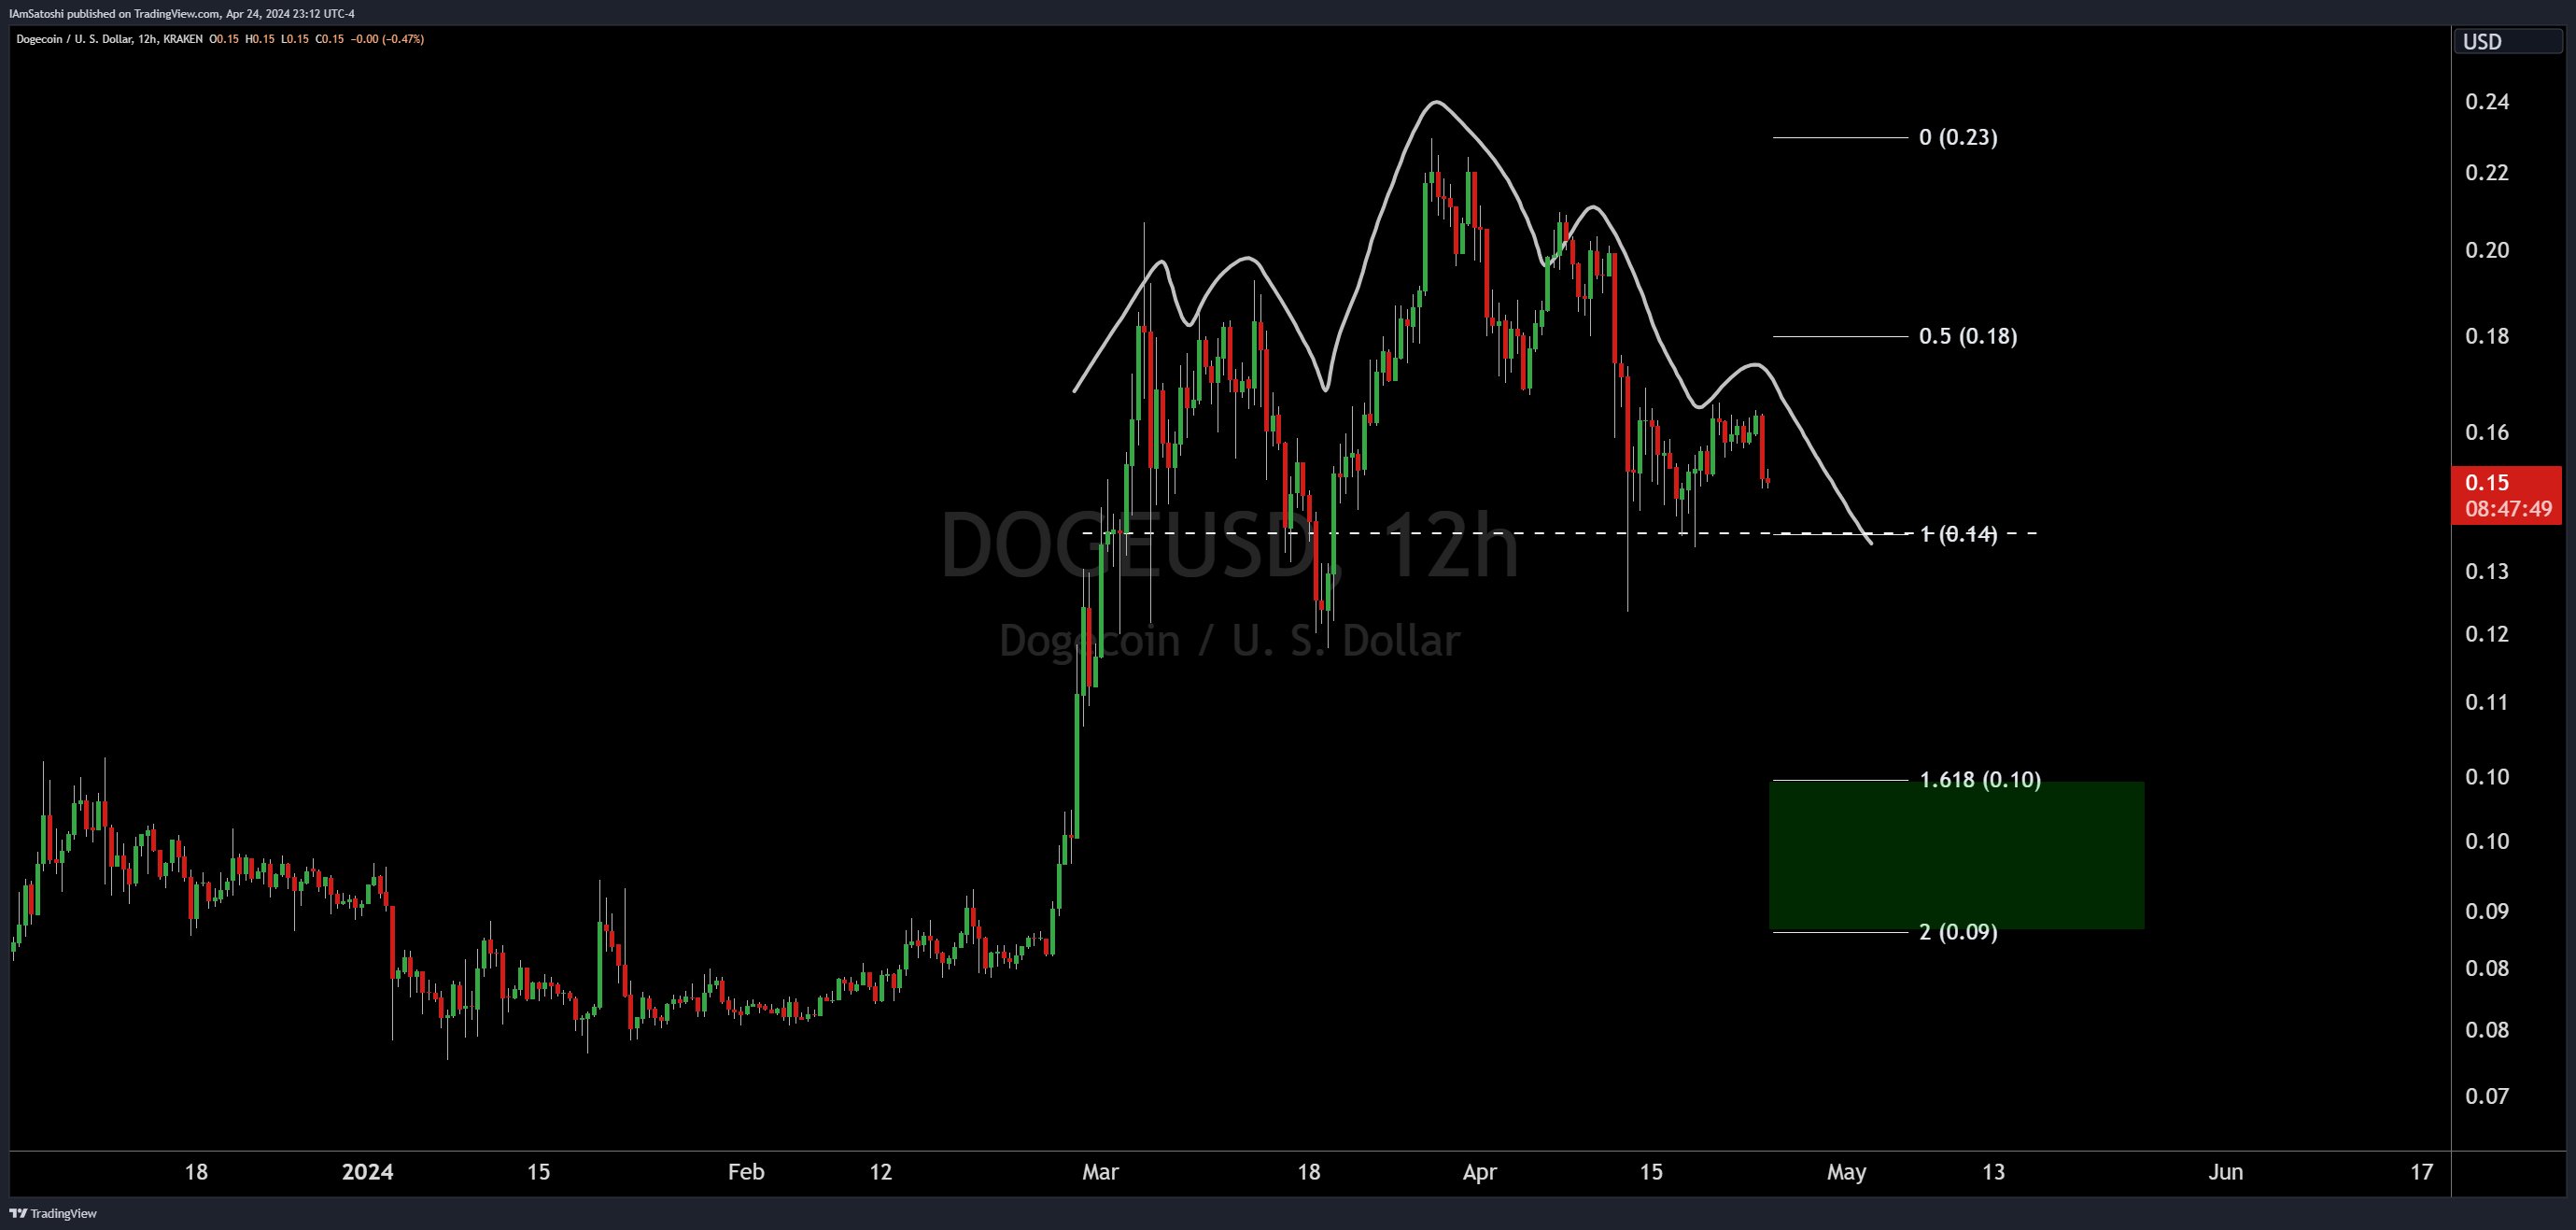
Technical analyst Josh Olszewicz (@CarpeNoctom) has identified a potential Head and Shoulders (H&S) formation on the DOGE/USD 12-hour chart, suggesting a potential significant price drop if the pattern holds true.
技术分析师 Josh Olszewicz (@CarpeNoctom) 在 DOGE/USD 12 小时图表上发现了潜在的头肩 (H&S) 形态,表明如果该模式成立,价格可能会大幅下跌。
The H&S pattern is a technical indicator traditionally viewed as a bearish signal. It consists of three peaks, with the central peak (the head) being the highest and the two outside peaks (the shoulders) being lower and approximately equal in height. The line connecting the lowest points of the two troughs (the neckline) can be horizontal or sloped and represents a critical support level.
H&S 模式是一种传统上被视为看跌信号的技术指标。它由三个峰组成,中央峰(头部)最高,两个外侧峰(肩部)较低,高度大致相等。连接两个波谷最低点的线(颈线)可以是水平的,也可以是倾斜的,代表关键支撑位。
Dogecoin Must Hold $0.14
狗狗币必须持有 0.14 美元
On Dogecoin's 12-hour chart, the price has formed the left shoulder and the head, with the right shoulder currently forming. The neckline of this H&S pattern is identified at approximately $0.14, as annotated by Olszewicz. This level is crucial; a decisive break below could confirm the bearish forecast suggested by the H&S formation.
在狗狗币的 12 小时图表上,价格已形成左肩和头部,目前正在形成右肩。正如 Olszewicz 所注释的那样,该 H&S 模式的颈线确定为大约 0.14 美元。这个级别至关重要;果断跌破该水平可能会证实 H&S 形态所暗示的看跌预测。
 Dogecoin head & shoulder pattern, 12-hour chart | Source: X @CarpeNoctom
狗狗币头肩形态,12 小时图 |来源:X @CarpeNoctom
Another technical detail present on the chart is the Fibonacci retracement levels, which indicate potential support and resistance areas. They are based on Fibonacci numbers, a sequence known for its proportionality.
图表上的另一个技术细节是斐波那契回撤水平,它表明潜在的支撑和阻力区域。它们基于斐波那契数列,斐波那契数列以其比例性而闻名。
The 0.5 Fibonacci level aligns with the left shoulder around $0.18, while the 0 level coincides with the peak at approximately $0.23. These levels are key to determining potential support and resistance areas in the market.
0.5 斐波那契水平与 0.18 美元附近的左肩对齐,而 0 斐波那契水平与大约 0.23 美元的峰值重合。这些水平是确定市场潜在支撑和阻力区域的关键。
Olszewicz has also highlighted a projected target area based on the typical behavior of the H&S pattern. This bearish target is identified using the height of the pattern from the head's peak to the neckline, projected downward from the point of the neckline break. The target box, marked in green, shows a potential decline to $0.10 to $0.09, coinciding with the 1.618 and 2.0 Fibonacci extension levels. A fall to this level could lead to a price crash of 40%.
Olszewicz 还强调了基于 H&S 模式典型行为的预测目标区域。这个看跌目标是通过从头顶到颈线的形态高度来确定的,从颈线突破点向下投影。目标框以绿色标记,显示潜在下跌至 0.10 美元至 0.09 美元,与 1.618 和 2.0 斐波那契扩展水平一致。跌至这一水平可能会导致价格暴跌 40%。
The H&S pattern is a reliable trend reversal signal. It is validated when the price breaks below the neckline following the formation of the right shoulder. For traders and investors, this pattern serves as a warning to prepare for potential downside risks.
H&S 形态是可靠的趋势反转信号。当价格在右肩形成后跌破颈线时,该信号得到验证。对于交易者和投资者来说,这种模式可以作为警告,为潜在的下行风险做好准备。
As of the latest chart by Olszewicz, the neckline has not been breached, and the pattern has yet to be confirmed. It is critical to watch the $0.14 level closely, as a break below it would likely trigger a sell-off, fulfilling the H&S prophecy. However, until such a break occurs, the pattern remains a watchful indicator rather than a confirmed trend reversal.
截至 Olszewicz 的最新图表,颈线尚未被突破,该形态尚未得到确认。密切关注 0.14 美元水平至关重要,因为跌破该水平可能会引发抛售,从而实现 H&S 预言。然而,在这种突破发生之前,该模式仍然是一个值得警惕的指标,而不是确认的趋势逆转。
In summary, Dogecoin's price chart is showing signs that could concern bullish investors. If history repeats itself, the emerging H&S pattern suggests a possible downward move in Dogecoin's value in the near future. However, only a decisive break below the neckline will validate this pattern, turning a watchful eye into a bearish outlook.
总之,狗狗币的价格图表显示出可能令看涨投资者担忧的迹象。如果历史重演,新兴的 H&S 模式表明狗狗币的价值在不久的将来可能会下跌。然而,只有果断突破颈线才能验证这一模式,从而将警惕的目光转变为看跌前景。
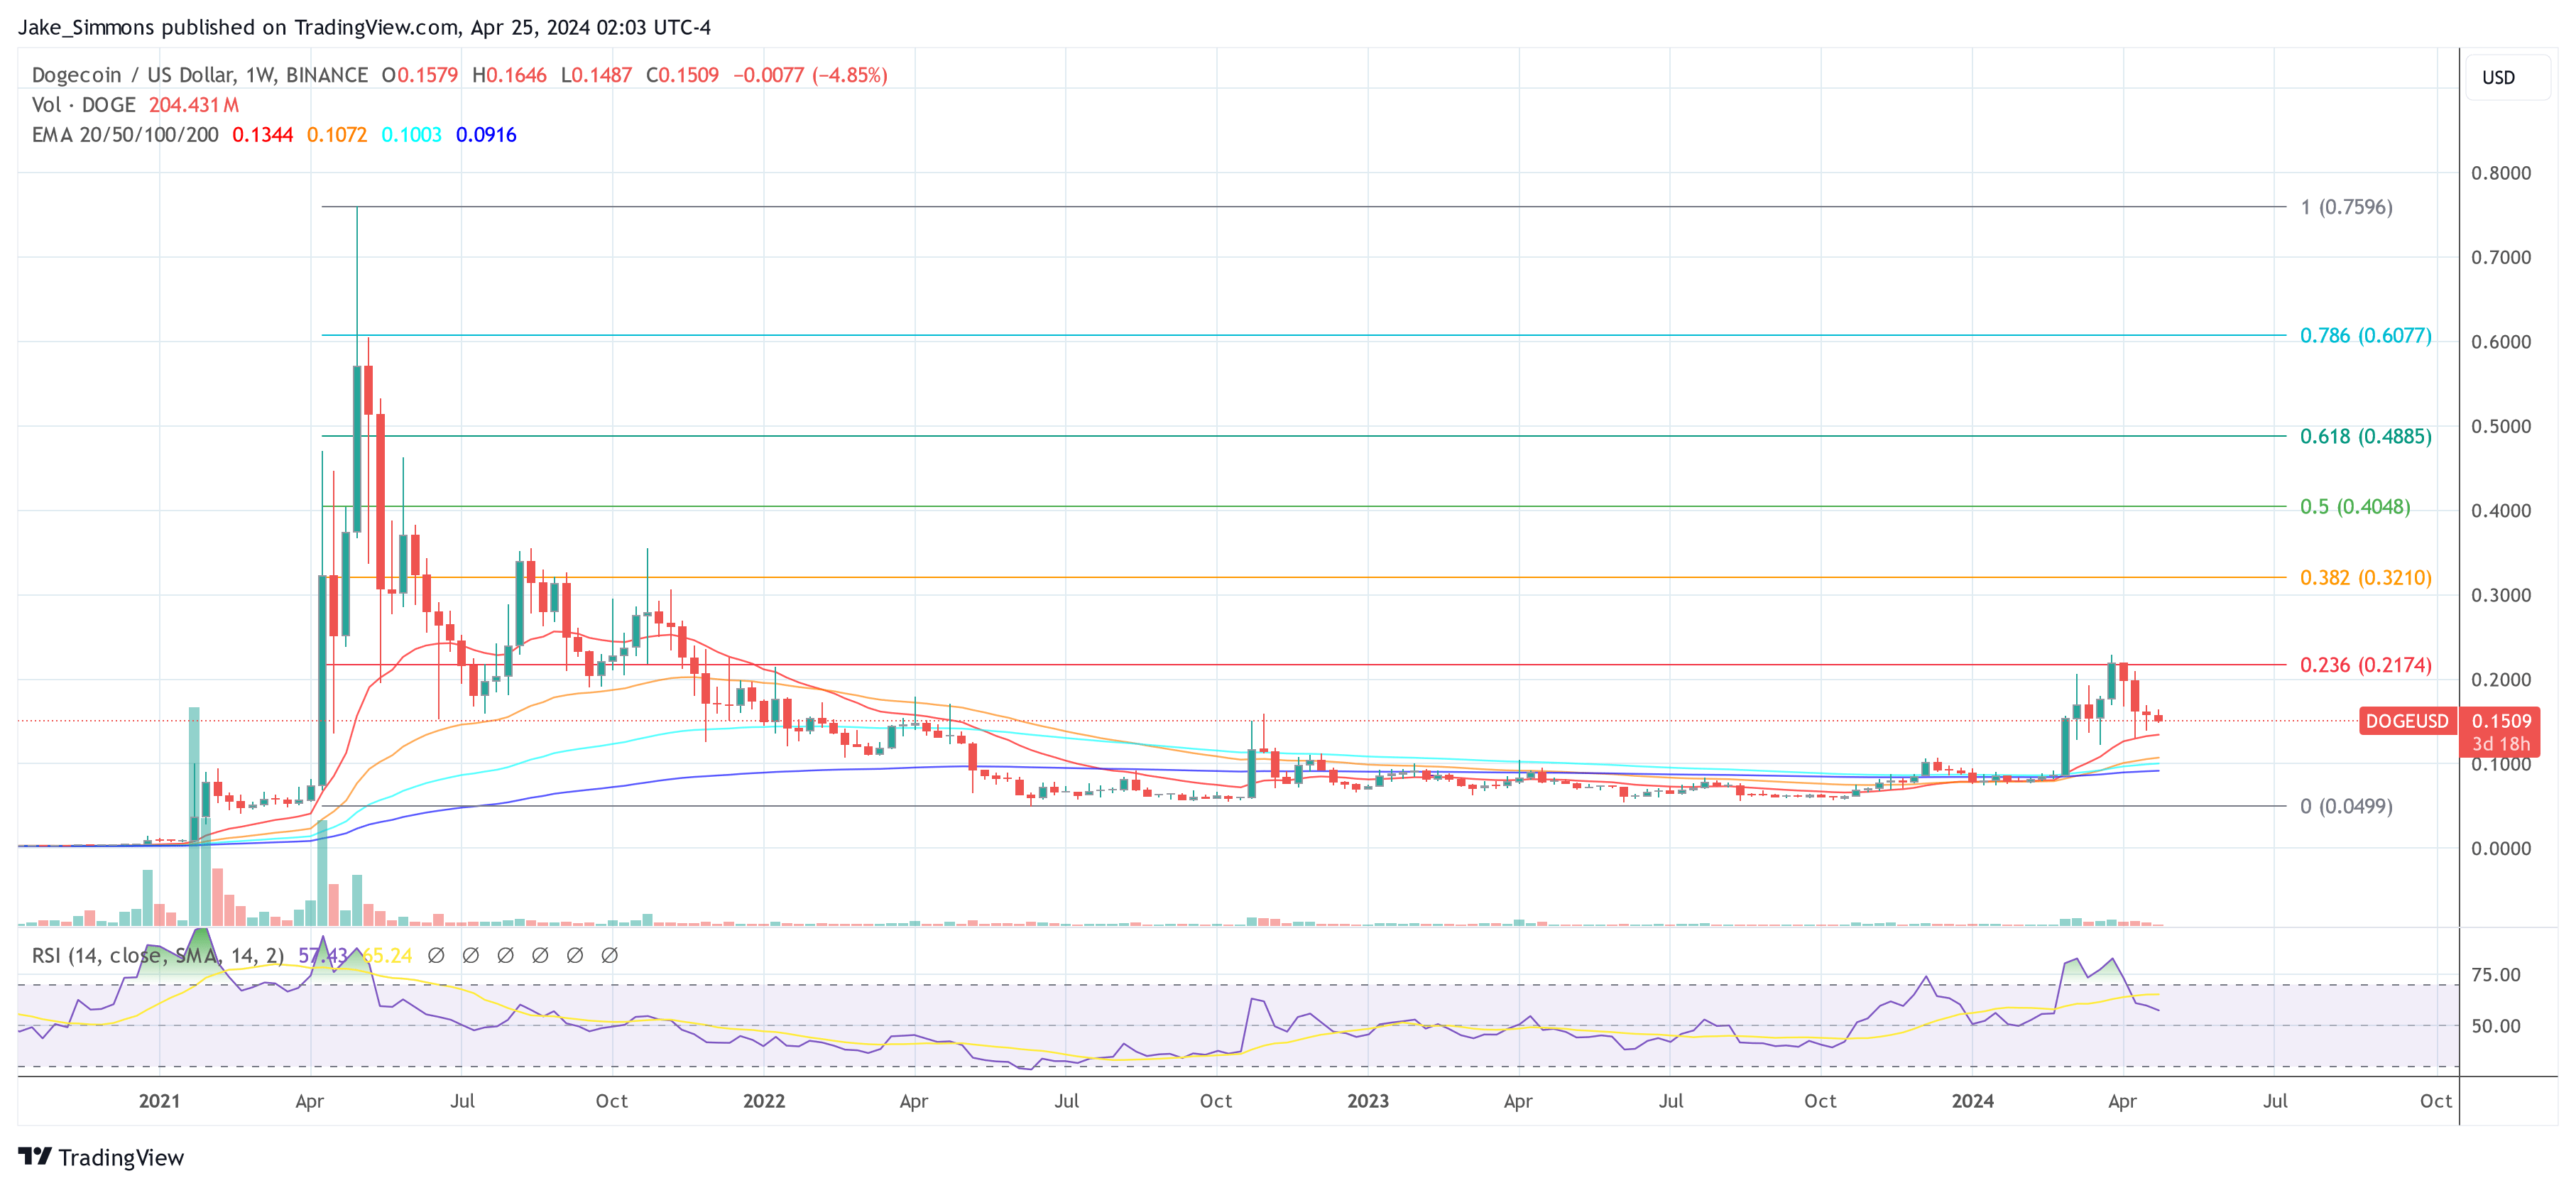
At press time, DOGE traded at $0.1509.
截至发稿时,DOGE 交易价格为 0.1509 美元。
 DOGE price, 1-week chart | Source: DOGEUSD on TradingView.com
DOGE 价格,1 周图表 |资料来源:TradingView.com 上的 DOGEUSD
Featured image created with DALL·E, chart from TradingView.com
使用 DALL·E 创建的特色图片,图表来自 TradingView.com
Disclaimer: The article is provided for educational purposes only. It does not represent the opinions of NewsBTC on whether to buy, sell, or hold any investments, and investing naturally carries risks. You are advised to conduct your own research before making any investment decisions. Use information provided on this website entirely at your own risk.
免责声明:本文仅供教育目的。并不代表NewsBTC对于是否购买、出售或持有任何投资的意见,投资自然带有风险。建议您在做出任何投资决定之前进行自己的研究。使用本网站提供的信息的风险完全由您自行承担。


 CFN
CFN U_Today
 Thecoinrepublic.com
 DogeHome
 Optimisus
 Optimisus
 DeFi Planet
 Crypto Daily™
 BlockchainReporter


