

Crypto analysts sound the alarm on Dogecoin as a classic chart pattern emerges
古典的なチャートパターンが出現する中、暗号アナリストがドージコインに警鐘を鳴らす
Technical analyst Josh Olszewicz (@CarpeNoctom) has identified a potential Head and Shoulders (H&S) formation on the DOGE/USD 12-hour chart, suggesting a potential significant price drop if the pattern holds true.
テクニカルアナリストのJosh Olszewicz氏(@CarpeNoctom)は、DOGE/USDの12時間足チャートで潜在的なヘッドアンドショルダー(H&S)形成を特定し、このパターンが当てはまる場合には大幅な価格下落の可能性を示唆しています。
The H&S pattern is a technical indicator traditionally viewed as a bearish signal. It consists of three peaks, with the central peak (the head) being the highest and the two outside peaks (the shoulders) being lower and approximately equal in height. The line connecting the lowest points of the two troughs (the neckline) can be horizontal or sloped and represents a critical support level.
H&S パターンは、伝統的に弱気シグナルとみなされているテクニカル指標です。 3 つのピークで構成され、中央のピーク (頭) が最も高く、外側の 2 つのピーク (肩) は低く、高さがほぼ同じです。 2 つの谷の最低点を結んだ線 (ネックライン) は水平または傾斜しており、重要なサポート レベルを表します。
Dogecoin Must Hold $0.14
ドージコインは0.14ドルを保持する必要があります
On Dogecoin's 12-hour chart, the price has formed the left shoulder and the head, with the right shoulder currently forming. The neckline of this H&S pattern is identified at approximately $0.14, as annotated by Olszewicz. This level is crucial; a decisive break below could confirm the bearish forecast suggested by the H&S formation.
ドージコインの12時間チャートでは、価格は左肩と頭を形成しており、現在は右肩を形成しています。 Olszewicz が注釈を付けたように、この H&S パターンのネックラインは約 0.14 ドルであると特定されています。このレベルは非常に重要です。以下の決定的なブレイクは、H&S フォーメーションが示唆する弱気予測を裏付ける可能性があります。
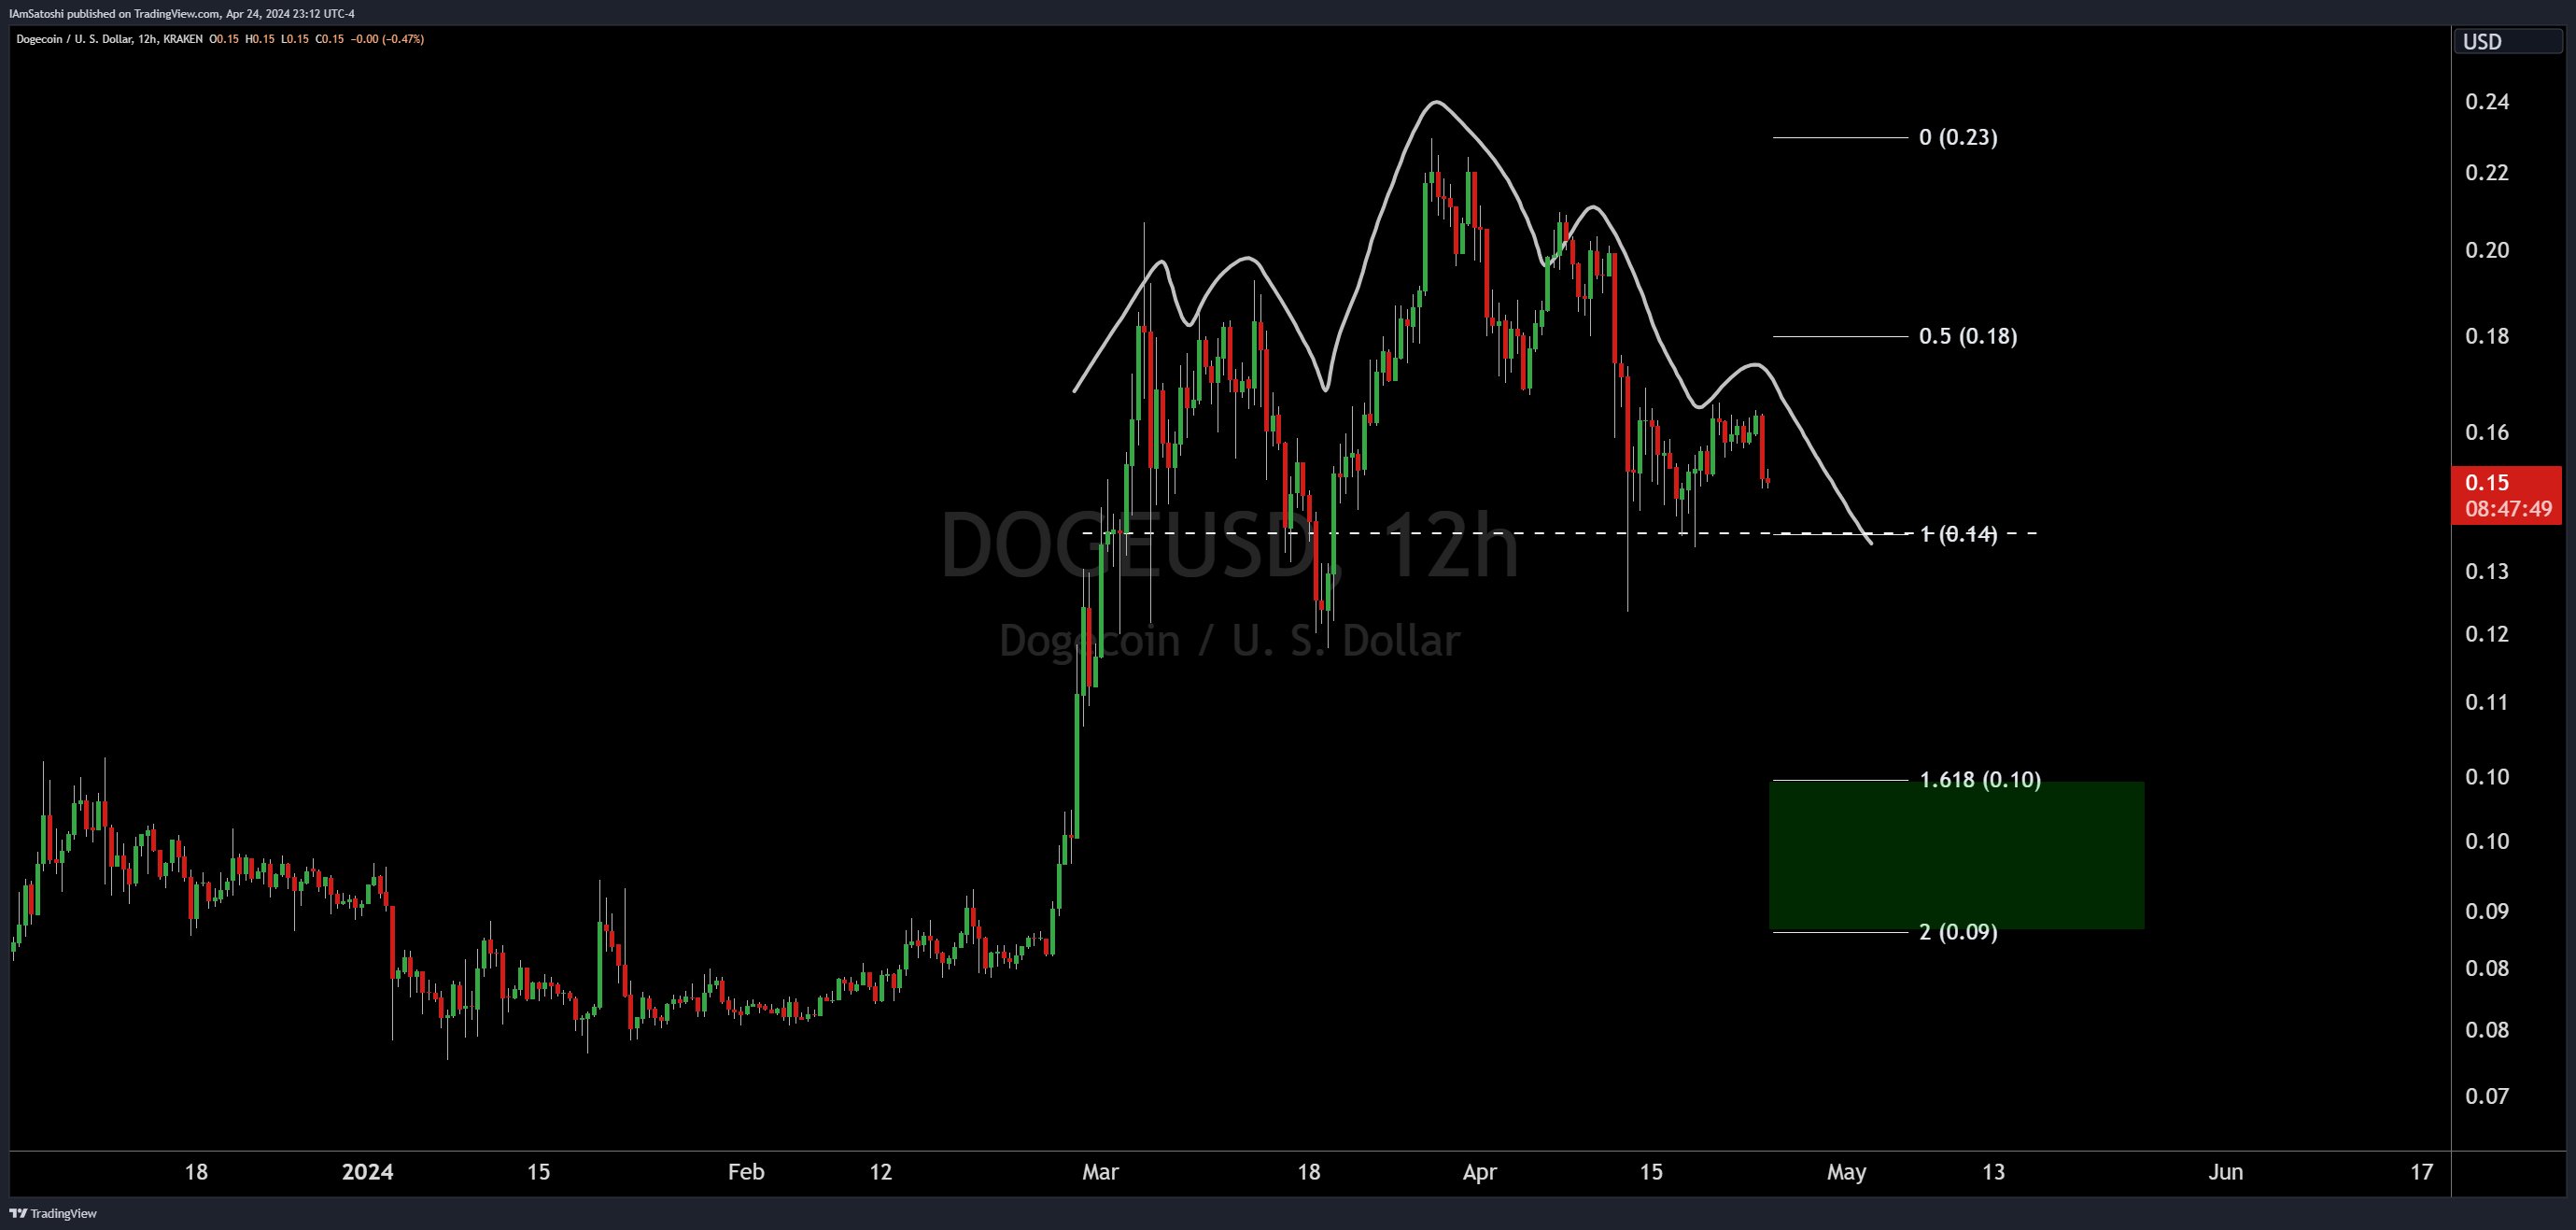 Dogecoin head & shoulder pattern, 12-hour chart | Source: X @CarpeNoctom
ドージコインのヘッド&ショルダーパターン、12時間チャート |出典: X @CarpeNoctom
Another technical detail present on the chart is the Fibonacci retracement levels, which indicate potential support and resistance areas. They are based on Fibonacci numbers, a sequence known for its proportionality.
チャートに存在するもう 1 つの技術的な詳細は、潜在的なサポート領域とレジスタンス領域を示すフィボナッチ リトレースメント レベルです。これらは、比例性で知られる数列であるフィボナッチ数に基づいています。
The 0.5 Fibonacci level aligns with the left shoulder around $0.18, while the 0 level coincides with the peak at approximately $0.23. These levels are key to determining potential support and resistance areas in the market.
0.5 フィボナッチ レベルは約 0.18 ドルの左肩に一致し、0 レベルは約 0.23 ドルのピークと一致します。これらのレベルは、市場の潜在的なサポート領域とレジスタンス領域を決定するための鍵となります。
Olszewicz has also highlighted a projected target area based on the typical behavior of the H&S pattern. This bearish target is identified using the height of the pattern from the head's peak to the neckline, projected downward from the point of the neckline break. The target box, marked in green, shows a potential decline to $0.10 to $0.09, coinciding with the 1.618 and 2.0 Fibonacci extension levels. A fall to this level could lead to a price crash of 40%.
Olszewicz 氏は、H&S パターンの典型的な動作に基づいて予測されるターゲット領域も強調しました。この弱気のターゲットは、ネックラインのブレイク点から下方に投影された、ヘッドの頂点からネックラインまでのパターンの高さを使用して特定されます。緑色でマークされたターゲットボックスは、1.618 および 2.0 フィボナッチエクステンションレベルと一致し、0.10 ドルから 0.09 ドルまで下落する可能性を示しています。この水準まで下落すると40%の価格暴落が起きる可能性がある。
The H&S pattern is a reliable trend reversal signal. It is validated when the price breaks below the neckline following the formation of the right shoulder. For traders and investors, this pattern serves as a warning to prepare for potential downside risks.
H&S パターンは信頼できるトレンド反転シグナルです。右ショルダーの形成後に価格がネックラインを下抜けたときに検証されます。トレーダーや投資家にとって、このパターンは潜在的な下値リスクに備えるための警告として機能します。
As of the latest chart by Olszewicz, the neckline has not been breached, and the pattern has yet to be confirmed. It is critical to watch the $0.14 level closely, as a break below it would likely trigger a sell-off, fulfilling the H&S prophecy. However, until such a break occurs, the pattern remains a watchful indicator rather than a confirmed trend reversal.
オルシェヴィッチによる最新のチャートの時点では、ネックラインは突破されておらず、パターンはまだ確認されていません。 0.14ドルの水準を注意深く監視することが重要である。これを下回ると売りが誘発され、H&Sの予言が成就する可能性が高いからだ。ただし、そのようなブレイクが発生するまでは、このパターンはトレンドの反転が確認されるというよりも、監視の指標にとどまります。
In summary, Dogecoin's price chart is showing signs that could concern bullish investors. If history repeats itself, the emerging H&S pattern suggests a possible downward move in Dogecoin's value in the near future. However, only a decisive break below the neckline will validate this pattern, turning a watchful eye into a bearish outlook.
要約すると、ドージコインの価格チャートは、強気の投資家にとって懸念される可能性のある兆候を示しています。歴史が繰り返されるとすれば、新たな H&S パターンは、近い将来にドージコインの価値が下落する可能性を示唆しています。しかし、ネックラインを決定的に下抜けた場合のみ、このパターンが実証され、警戒心が弱気の見通しに変わります。
At press time, DOGE traded at $0.1509.
記事執筆時点では、DOGEは0.1509ドルで取引されていました。
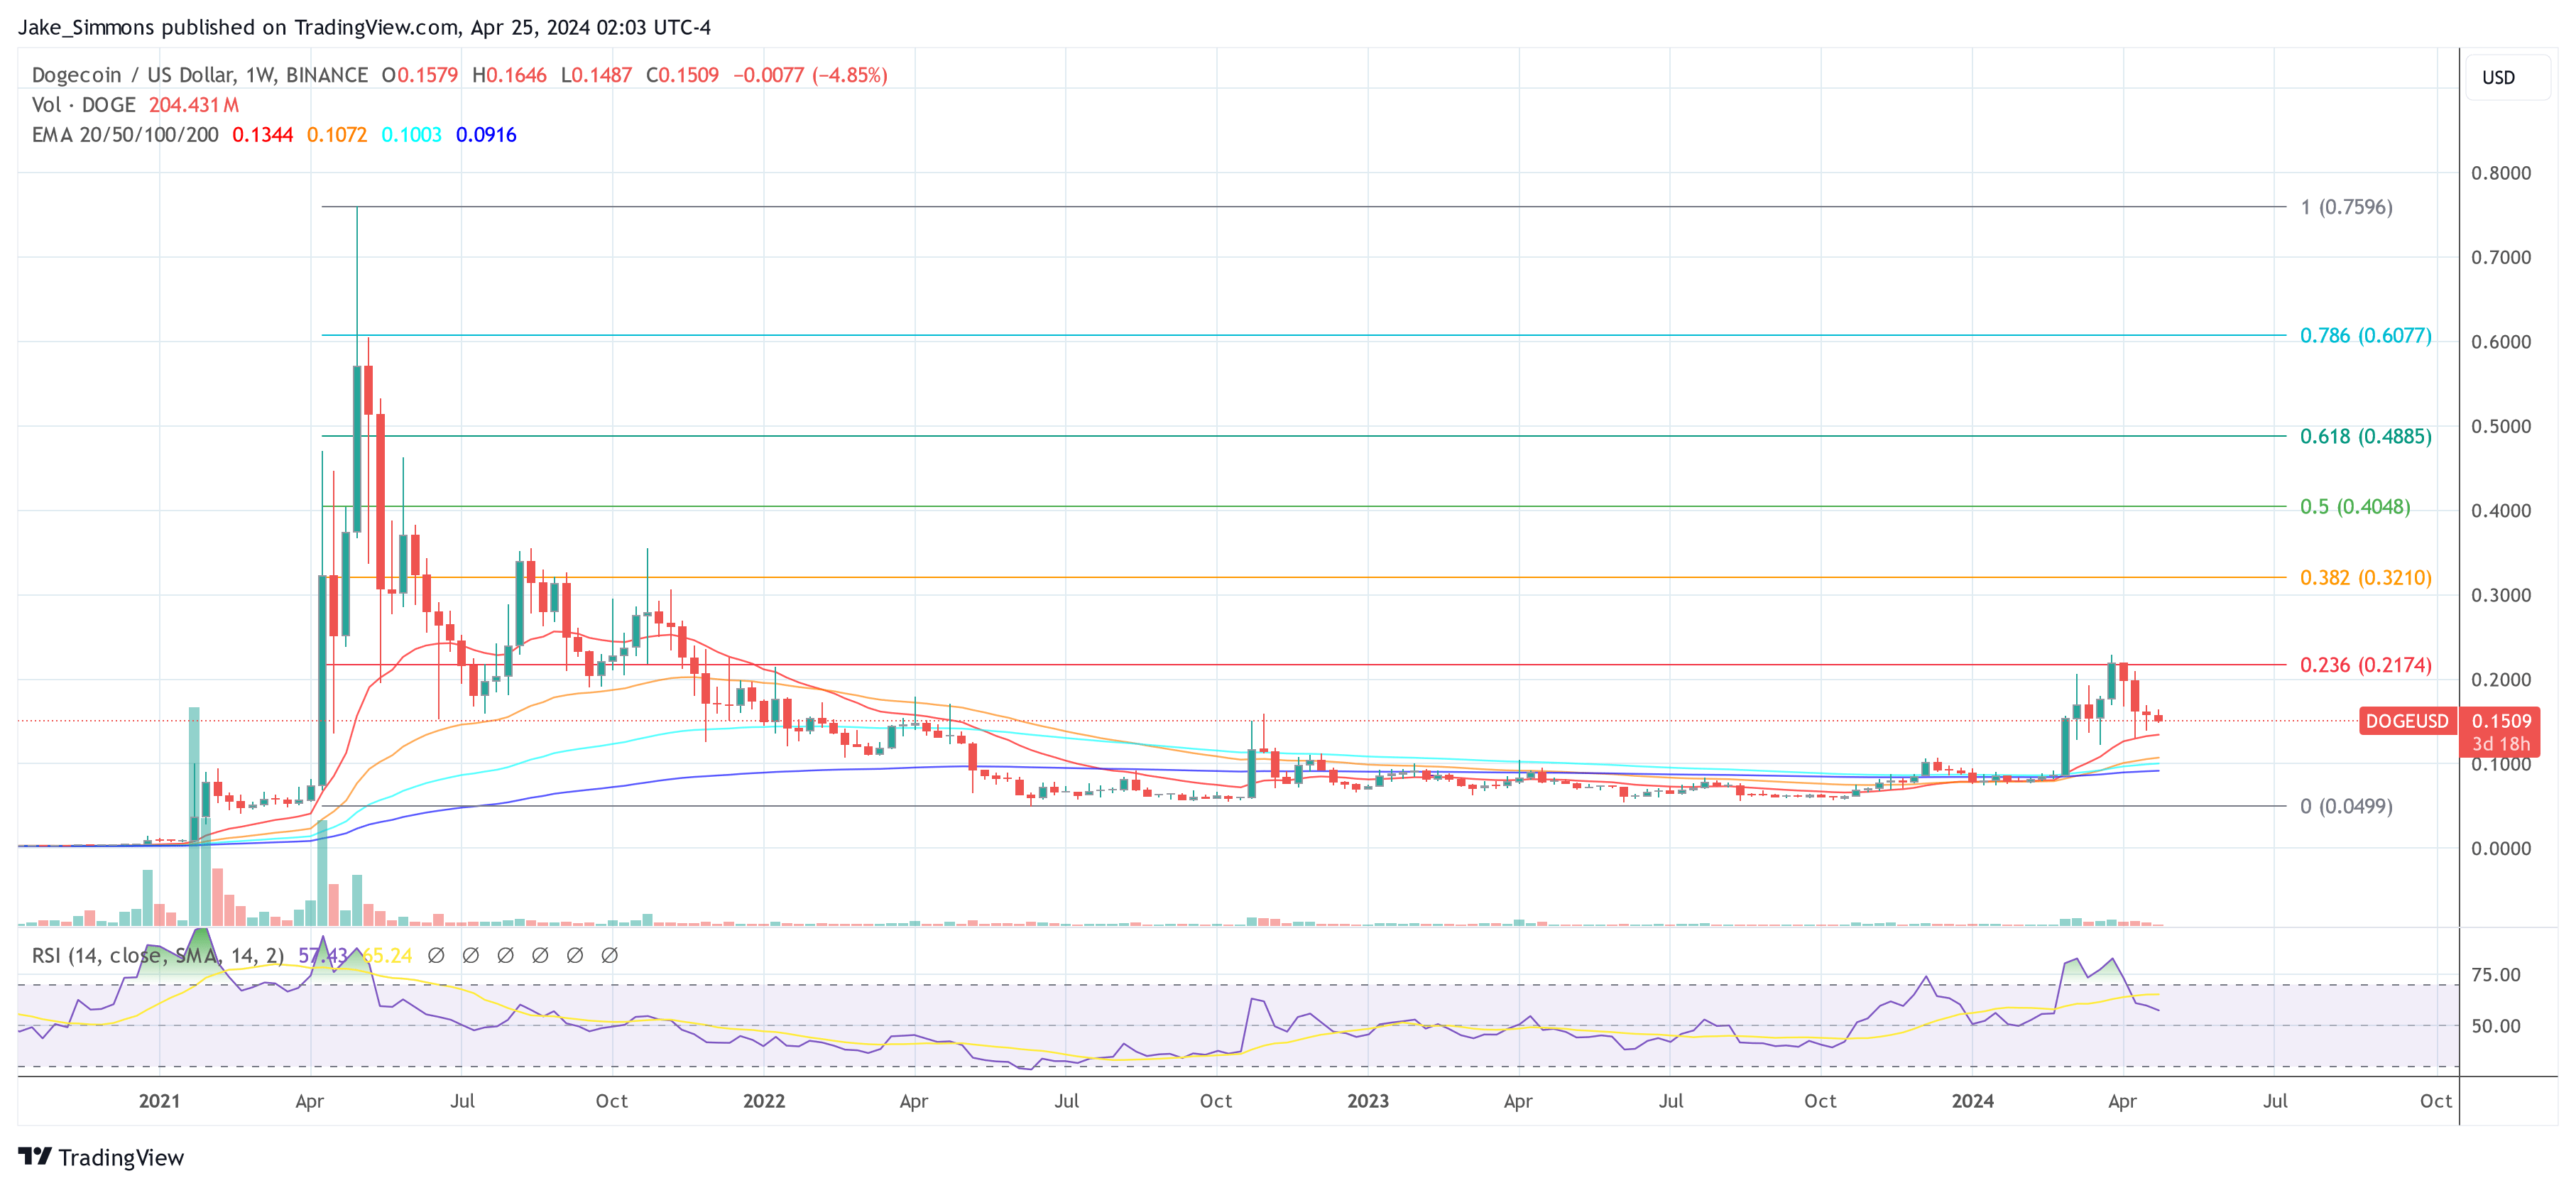 DOGE price, 1-week chart | Source: DOGEUSD on TradingView.com
DOGE価格、1週間チャート |出典: TradingView.comのDOGEUSD
Featured image created with DALL·E, chart from TradingView.com
DALL・Eで作成された注目の画像、TradingView.comのチャート
Disclaimer: The article is provided for educational purposes only. It does not represent the opinions of NewsBTC on whether to buy, sell, or hold any investments, and investing naturally carries risks. You are advised to conduct your own research before making any investment decisions. Use information provided on this website entirely at your own risk.
免責事項: この記事は教育目的のみに提供されています。これは、投資を購入、売却、または保有するかどうかに関する NewsBTC の意見を表すものではなく、投資には当然リスクが伴います。投資を決定する前に、ご自身で調査を行うことをお勧めします。このウェブサイトで提供される情報は完全に自己責任でご利用ください。
 Optimisus
 COINTURK NEWS
 BH NEWS
 BlockchainReporter
 DogeHome
 U_Today
 U_Today
 Optimisus
 Crypto Front News


