Bitcoin price reflects a 13% increase over the past month.
On May 21, BTC hit a 1-month-high of $71,946.
Bitcoin (BTC) witnessed a significant ‘bull versus bear’ momentum throughout May, fluctuating within the $62,000-$70,000 range. Over the past 30 days, this largest cryptocurrency by market cap surged over 13%. As of late May, BTC teased a brief bullish rally to near its all-time high (ATH) while facing multiple hurdles.
Noting a decline of 1% in the last 24 hours, BTC traded at $68,541, at the time of writing. According to data, the daily trading volume stood at $18.75 billion, reflecting an increase of 20.8%. The asset’s price recently passed through several resistance levels, reaching a high of around $72,000. This notable price surge during the US Crypto scene spurred the community to anticipate BTC’s movement closer to its ATH of $73,750.
What is BTC’s Next Target?
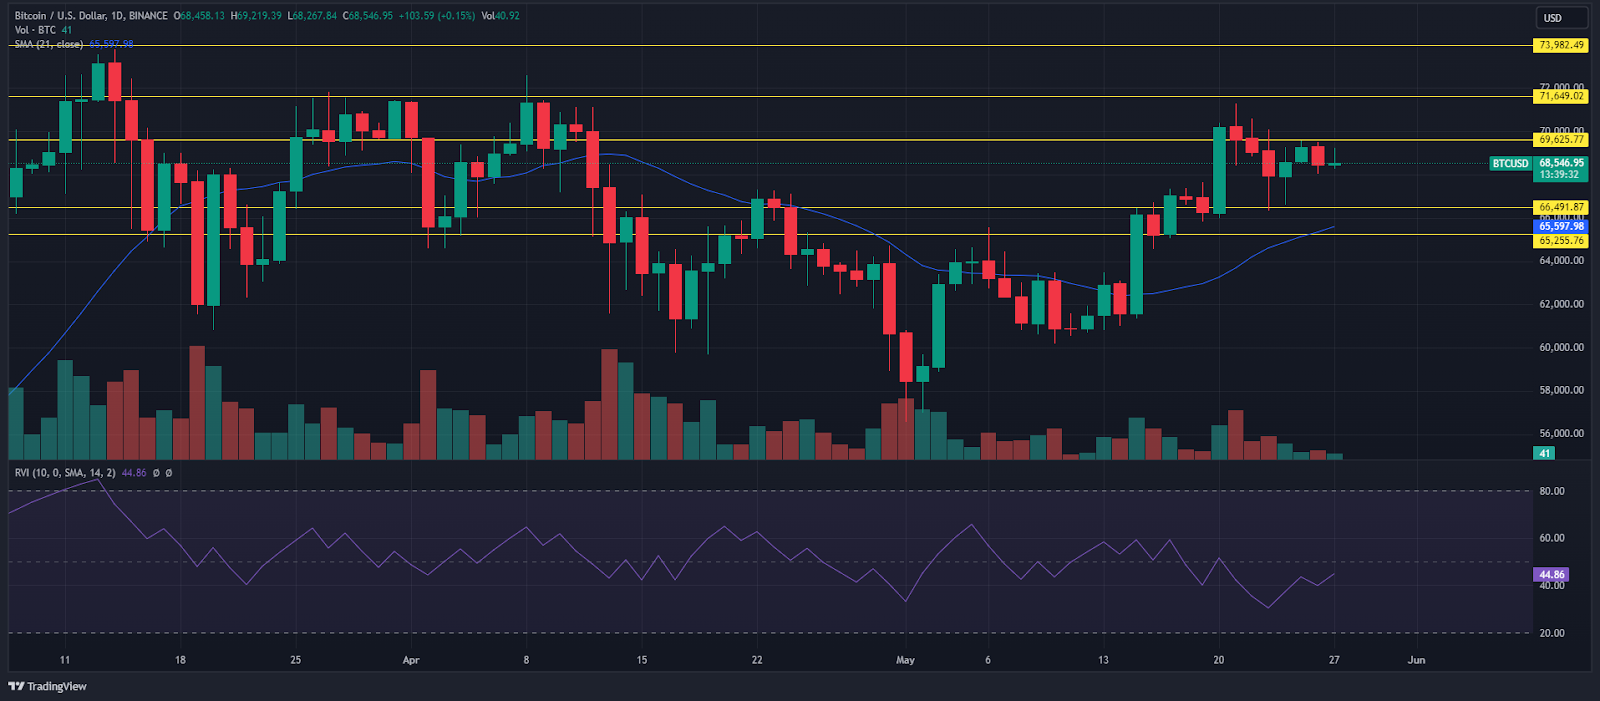
Despite the mixed signals, BTC remains bullish as the current price exceeds the 21-day moving average (21MA). With respect to its daily RSI which stands at 45.72, we could infer that BTC is rising closer to the neutral zone, neither overbought nor oversold zone.

BTC 24H Price Chart (Source: TradingView)
Analyzing the 24-hour price chart, Bitcoin’s key resistances are noted in the $69K-$73K range. Initially, it might test a resistance of $69,625. If the bullish trend persists, the next key resistance might be $71,649. Furthermore, the higher target might be marked at $73,982, a new ATH.
Conversely, if the bears take the lead, we may witness Bitcoin price forming bottoms within the $65K-$67.5K range. When it takes up the bearish route, BTC might fall to a support of $66,491. In the case of strong bearish cues, the price of BTC would bottom further to $65,255.
Meanwhile, the second largest cryptocurrency, Ethereum (ETH) surged 25% over the past 30 days and entered the $3.9K zone. At the time of writing, ETH price was at $3,902 with a 24-hour increase of 2.6%, as per CMC.
Highlighted News of the Day
Pepe Coin Flips Uniswap & Polygon in Market Cap


 crypto.ro English
 DogeHome
 Crypto News Land
 ETHNews
 CFN
CFN U_Today
 Thecoinrepublic.com
 Optimisus


