Bitcoin price reflects a 13% increase over the past month.
On May 21, BTC hit a 1-month-high of $71,946.
比特幣價格較過去一個月上漲了 13%。
Bitcoin (BTC) witnessed a significant ‘bull versus bear’ momentum throughout May, fluctuating within the $62,000-$70,000 range. Over the past 30 days, this largest cryptocurrency by market cap surged over 13%. As of late May, BTC teased a brief bullish rally to near its all-time high (ATH) while facing multiple hurdles.
整個 5 月份,比特幣 (BTC) 出現了明顯的「牛市與熊市」勢頭,在 62,000 美元至 70,000 美元的範圍內波動。在過去 30 天裡,這種市值最大的加密貨幣飆升了 13% 以上。截至 5 月底,比特幣出現了短暫的看漲反彈,接近歷史高點 (ATH),同時面臨多重障礙。
Noting a decline of 1% in the last 24 hours, BTC traded at $68,541, at the time of writing. According to data, the daily trading volume stood at $18.75 billion, reflecting an increase of 20.8%. The asset’s price recently passed through several resistance levels, reaching a high of around $72,000. This notable price surge during the US Crypto scene spurred the community to anticipate BTC’s movement closer to its ATH of $73,750.
截至撰寫本文時,BTC 的交易價格為 68,541 美元,過去 24 小時內下跌了 1%。數據顯示,每日交易量為187.5億美元,成長20.8%。該資產的價格最近突破了幾個阻力位,達到 72,000 美元左右的高點。美國加密貨幣領域的這一顯著價格飆升促使社區預計 BTC 的走勢將接近 73,750 美元的最高峰值。
What is BTC’s Next Target?
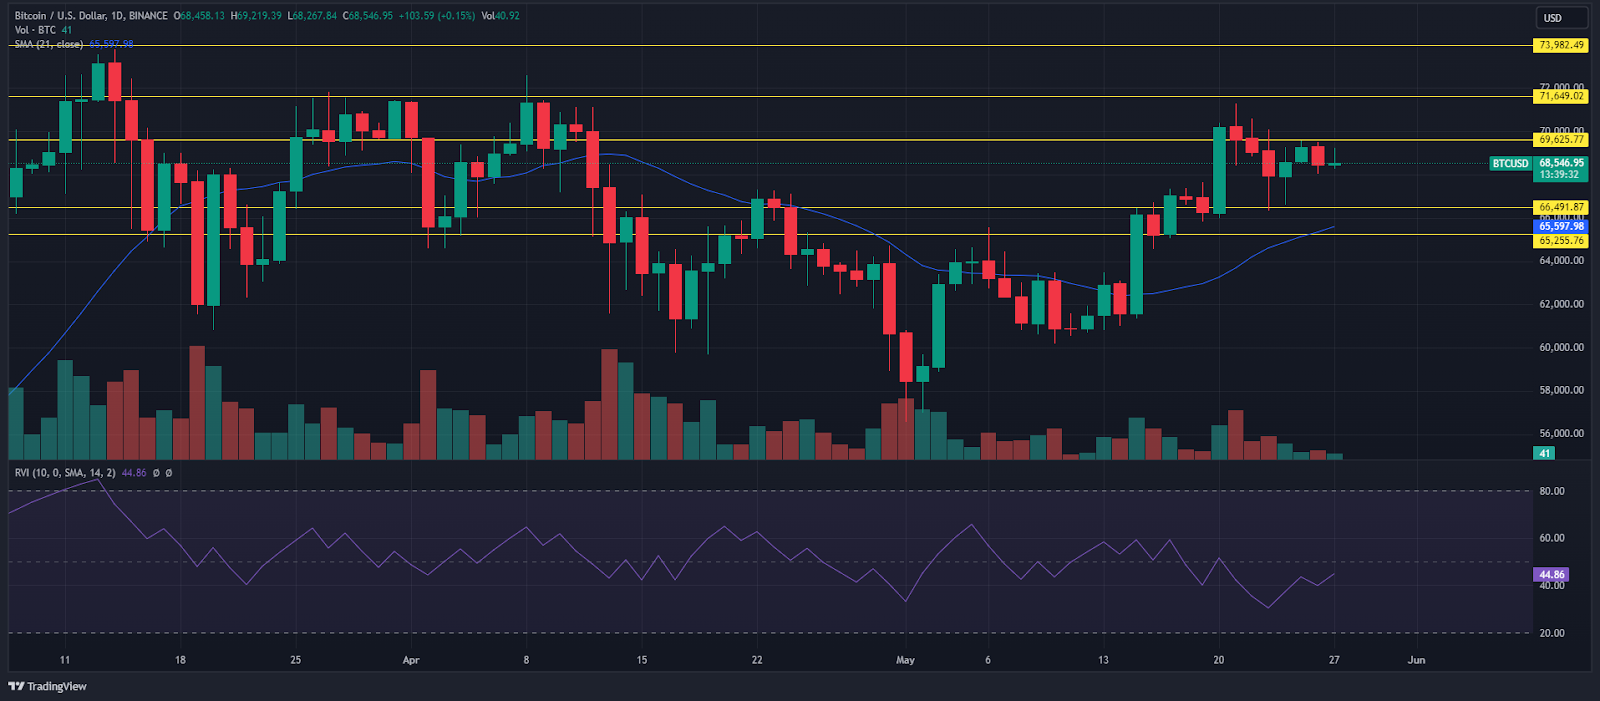
Despite the mixed signals, BTC remains bullish as the current price exceeds the 21-day moving average (21MA). With respect to its daily RSI which stands at 45.72, we could infer that BTC is rising closer to the neutral zone, neither overbought nor oversold zone.
BTC 的下一個目標是什麼? 儘管訊號好壞參半,但由於當前價格超過 21 日移動平均線(21MA),BTC 仍然看漲。就每日 RSI 45.72 而言,我們可以推斷 BTC 正在接近中性區域,既不是超買也不是超賣區域。

BTC 24H Price Chart (Source: TradingView)
BTC 24小時價格圖(圖片來源:TradingView)
Analyzing the 24-hour price chart, Bitcoin’s key resistances are noted in the $69K-$73K range. Initially, it might test a resistance of $69,625. If the bullish trend persists, the next key resistance might be $71,649. Furthermore, the higher target might be marked at $73,982, a new ATH.
分析 24 小時價格圖表,比特幣的主要阻力位在 6.9 萬美元至 7.3 萬美元範圍內。最初,它可能會測試 69,625 美元的阻力位。如果看漲趨勢持續下去,下一個關鍵阻力位可能是 71,649 美元。此外,更高的目標可能定為 73,982 美元,這是一個新的最高點。
Conversely, if the bears take the lead, we may witness Bitcoin price forming bottoms within the $65K-$67.5K range. When it takes up the bearish route, BTC might fall to a support of $66,491. In the case of strong bearish cues, the price of BTC would bottom further to $65,255.
相反,如果空頭佔據主導地位,我們可能會看到比特幣價格在 65,000 美元至 67,500 美元範圍內形成底部。當它走上看跌路線時,比特幣可能會跌至 66,491 美元的支撐位。如果出現強烈的看跌訊號,BTC 的價格將進一步探底至 65,255 美元。
Meanwhile, the second largest cryptocurrency, Ethereum (ETH) surged 25% over the past 30 days and entered the $3.9K zone. At the time of writing, ETH price was at $3,902 with a 24-hour increase of 2.6%, as per CMC.
與此同時,第二大加密貨幣以太幣 (ETH) 在過去 30 天內飆升 25%,進入 3900 美元區域。根據 CMC 的數據,截至撰寫本文時,ETH 價格為 3,902 美元,24 小時漲幅為 2.6%。
Highlighted News of the Day
Pepe Coin Flips Uniswap & Polygon in Market Cap
當日重點新聞Pepe Coin 顛覆 Uniswap 和 Polygon 市值


 Optimisus
 Crypto News Land
 Optimisus
 Cryptopolitan_News
 DogeHome
 Cryptopolitan
 crypto.ro English


