Bitcoin price reflects a 13% increase over the past month.
On May 21, BTC hit a 1-month-high of $71,946.
ビットコイン価格は先月の13%上昇を反映しており、5月21日にはビットコインは1カ月ぶりの高値となる7万1946ドルを記録した。
Bitcoin (BTC) witnessed a significant ‘bull versus bear’ momentum throughout May, fluctuating within the $62,000-$70,000 range. Over the past 30 days, this largest cryptocurrency by market cap surged over 13%. As of late May, BTC teased a brief bullish rally to near its all-time high (ATH) while facing multiple hurdles.
ビットコイン (BTC) は 5 月を通じて大きな「強気対弱気」の勢いを見せ、62,000 ドルから 70,000 ドルの範囲内で変動しました。過去 30 日間で、時価総額でこの最大の仮想通貨は 13% 以上急騰しました。 5月下旬の時点で、BTCは複数のハードルに直面しながらも、史上最高値(ATH)近くまでの短期間の強気上昇を示唆していた。
Noting a decline of 1% in the last 24 hours, BTC traded at $68,541, at the time of writing. According to data, the daily trading volume stood at $18.75 billion, reflecting an increase of 20.8%. The asset’s price recently passed through several resistance levels, reaching a high of around $72,000. This notable price surge during the US Crypto scene spurred the community to anticipate BTC’s movement closer to its ATH of $73,750.
過去 24 時間で 1% 下落したことに注目すると、記事執筆時点で BTC は 68,541 ドルで取引されています。データによると、1日の取引高は187億5000万ドルで、20.8%増加した。この資産の価格は最近いくつかの抵抗レベルを通過し、約72,000ドルの高値に達しました。米国の仮想通貨シーンにおけるこの注目すべき価格高騰により、コミュニティはBTCのATH値73,750ドルに近づくと予想するようになりました。
What is BTC’s Next Target?
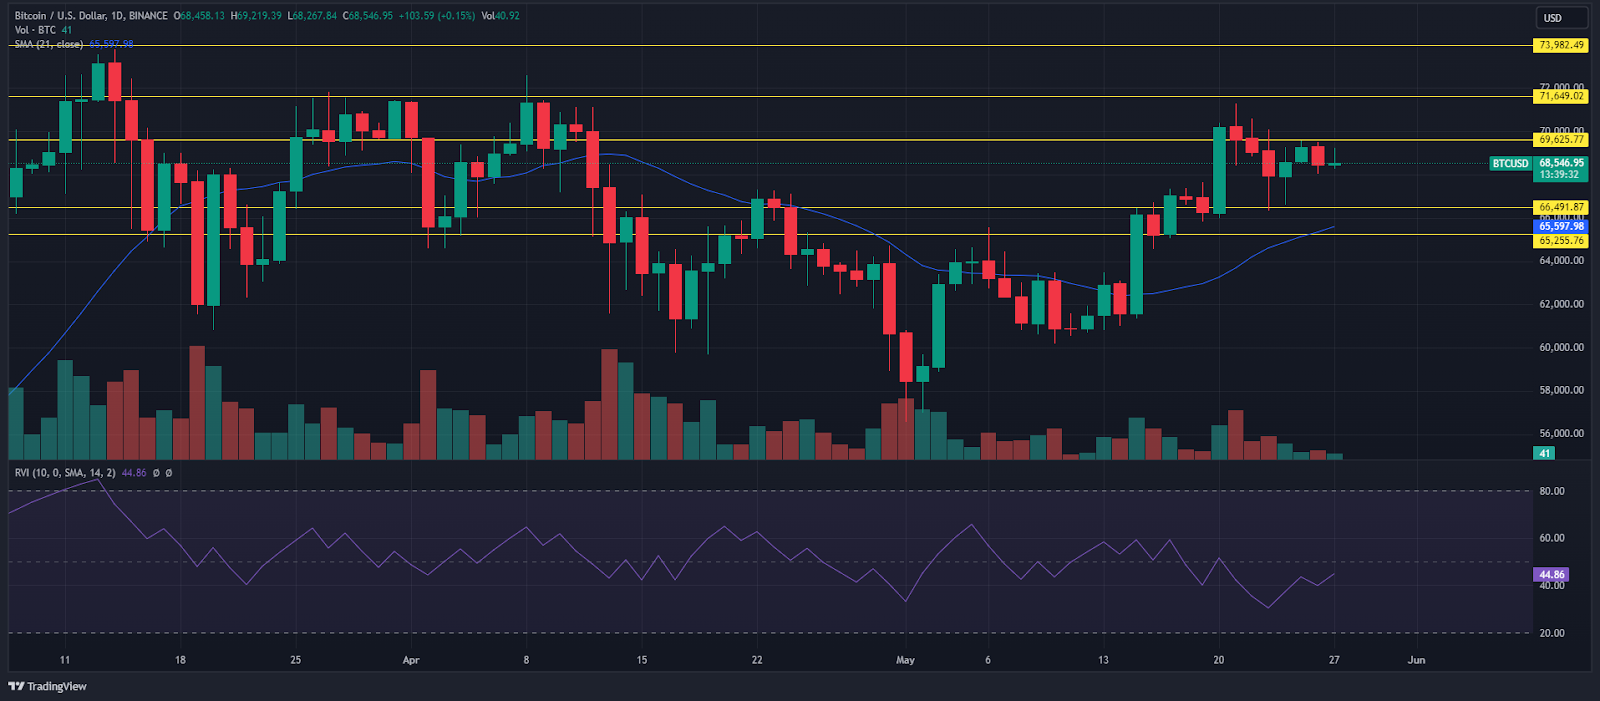
Despite the mixed signals, BTC remains bullish as the current price exceeds the 21-day moving average (21MA). With respect to its daily RSI which stands at 45.72, we could infer that BTC is rising closer to the neutral zone, neither overbought nor oversold zone.
BTC の次のターゲットは何ですか?シグナルはまちまちですが、現在の価格が 21 日移動平均 (21MA) を上回っているため、BTC は引き続き強気です。 45.72 にある日次 RSI に関しては、BTC が買われ過ぎでも売られ過ぎでもない中立ゾーンに近づいていると推測できます。

BTC 24H Price Chart (Source: TradingView)
BTC 24H価格チャート(出典:TradingView)
Analyzing the 24-hour price chart, Bitcoin’s key resistances are noted in the $69K-$73K range. Initially, it might test a resistance of $69,625. If the bullish trend persists, the next key resistance might be $71,649. Furthermore, the higher target might be marked at $73,982, a new ATH.
24時間の価格チャートを分析すると、ビットコインの主要な抵抗線は69,000ドルから73,000ドルの範囲にあることがわかります。当初は69,625ドルの抵抗線を試す可能性がある。強気傾向が続く場合、次の主要な抵抗線は 71,649 ドルになる可能性があります。さらに、より高い目標は、新しい ATH である 73,982 ドルにマークされる可能性があります。
Conversely, if the bears take the lead, we may witness Bitcoin price forming bottoms within the $65K-$67.5K range. When it takes up the bearish route, BTC might fall to a support of $66,491. In the case of strong bearish cues, the price of BTC would bottom further to $65,255.
逆に、弱気派が主導権を握った場合、ビットコイン価格が65,000ドルから67,000ドルの範囲内で底を形成するのを目撃する可能性があります。弱気路線を取る場合、BTCは66,491ドルのサポートまで下落する可能性がある。強い弱気の手がかりの場合、BTC価格はさらに65,255ドルまで下落するだろう。
Meanwhile, the second largest cryptocurrency, Ethereum (ETH) surged 25% over the past 30 days and entered the $3.9K zone. At the time of writing, ETH price was at $3,902 with a 24-hour increase of 2.6%, as per CMC.
一方、2番目に大きな仮想通貨であるイーサリアム(ETH)は過去30日間で25%急騰し、390万ドルゾーンに入った。 CMCによると、本稿執筆時点でETH価格は3,902ドルで、24時間で2.6%上昇した。
Highlighted News of the Day
Pepe Coin Flips Uniswap & Polygon in Market Cap
今日の注目ニュース Pepe Coin が Uniswap と Polygon の時価総額を反転


 Optimisus
 Cryptopolitan_News
 DogeHome
 Cryptopolitan
 crypto.ro English
 Crypto News Land
 ETHNews


