You can also read this news on COINTURK NEWS: Cryptocurrency Market Trends: Bitcoin Leads as Altcoins Gain Momentum
The cryptocurrency market, led by Bitcoin, continues to experience significant developments. During this period, there is a notable flow of money into the altcoin market, and many altcoin projects keep their investors happy. So, what is happening on the fronts of Solana, Cardano, and Dogecoin during this process? We examine with detailed chart analysis and key support and resistance levels.
Solana Chart Analysis
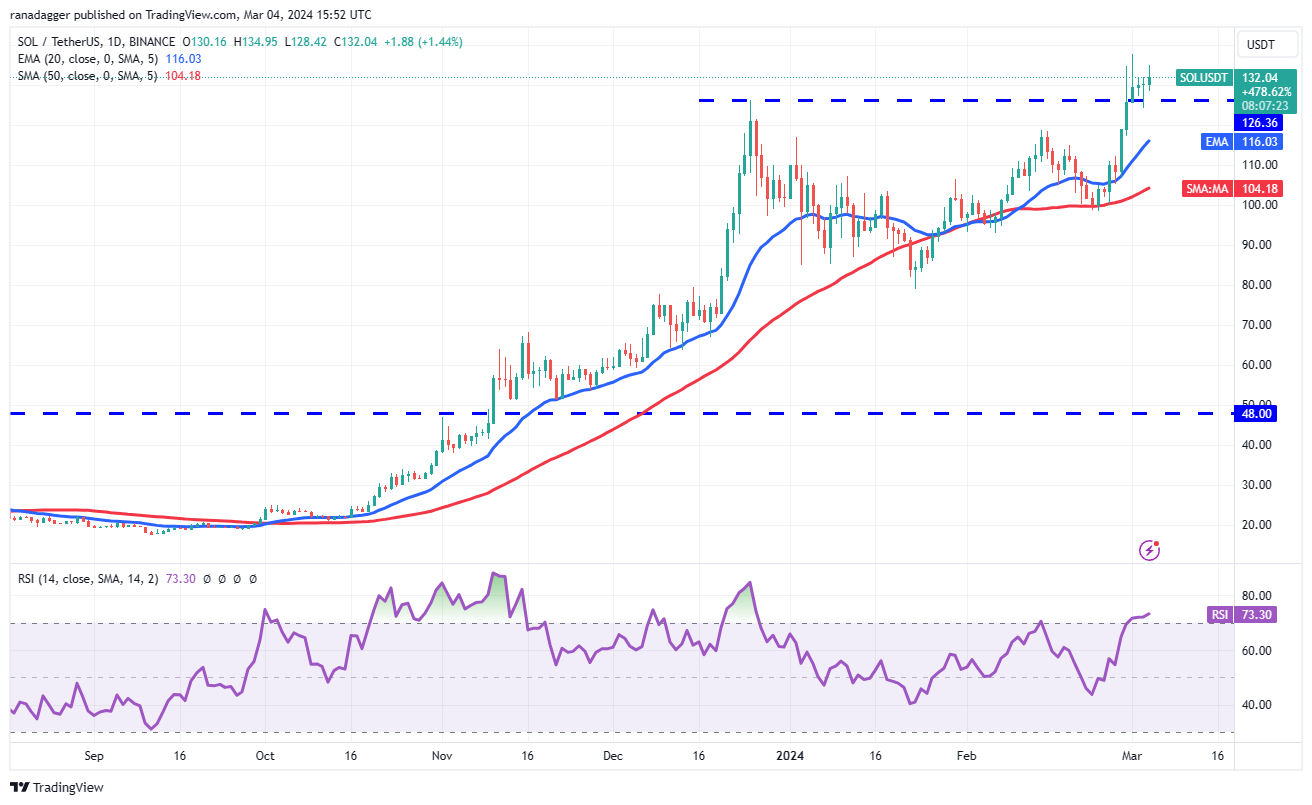
Solana closed above the $126 resistance on March 1st, but bulls are struggling to maintain momentum. This indicates a lack of demand at higher levels. If the price remains above $126, the likelihood of a renewed uptrend increases. If buyers surpass the $138 level, the SOL/USDT pair is likely to rise to $143 and then to $158.

Contrary to this assumption, if the $126 level is breached, the pair could fall to the 20-day EMA average of $116. Bears will have to push the price below the 20-day EMA average to argue that the break above $126 was a false move. The pair could then drop to the 50-day SMA average of $104.
Cardano Chart Analysis
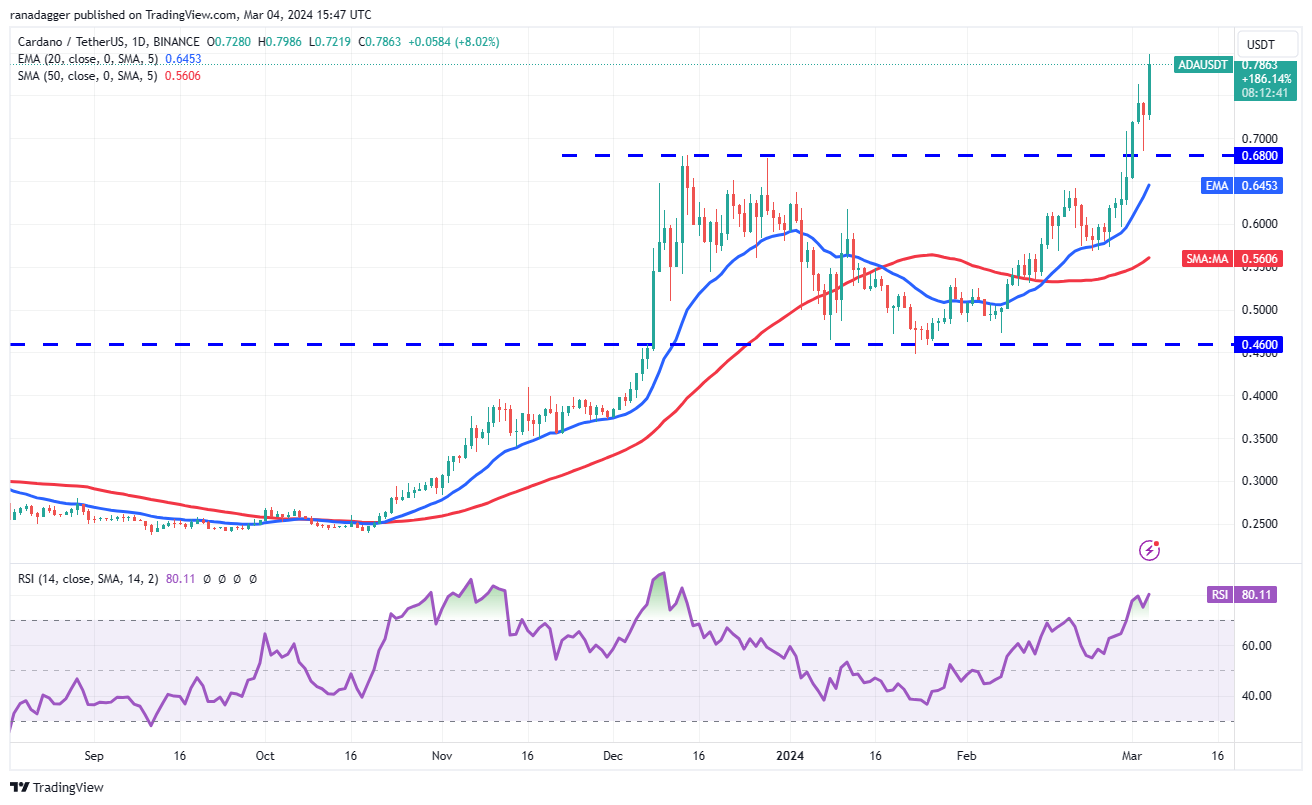
Cardano started the next leg of its uptrend after buyers overcame the $0.68 resistance on March 1st. Bears tried to pull the price below the breakout level on March 3rd, but bulls held their ground. This shows strong buying on dips.

The upward move is expected to reach $0.90, where bears are likely to mount a strong defense. If momentum remains strong and buyers push towards $0.90, the rise could extend to $1.25. Bulls may struggle to surpass this level.
The RSI level has risen above 80, indicating the rally may be at risk of stalling. The 20-day EMA average of $0.64 continues to be the key support to watch on the downside. A break and close below this level would signal the bulls losing control. The ADA/USDT pair could then fall to the 50-day SMA average of $0.56.
Dogecoin Chart Analysis
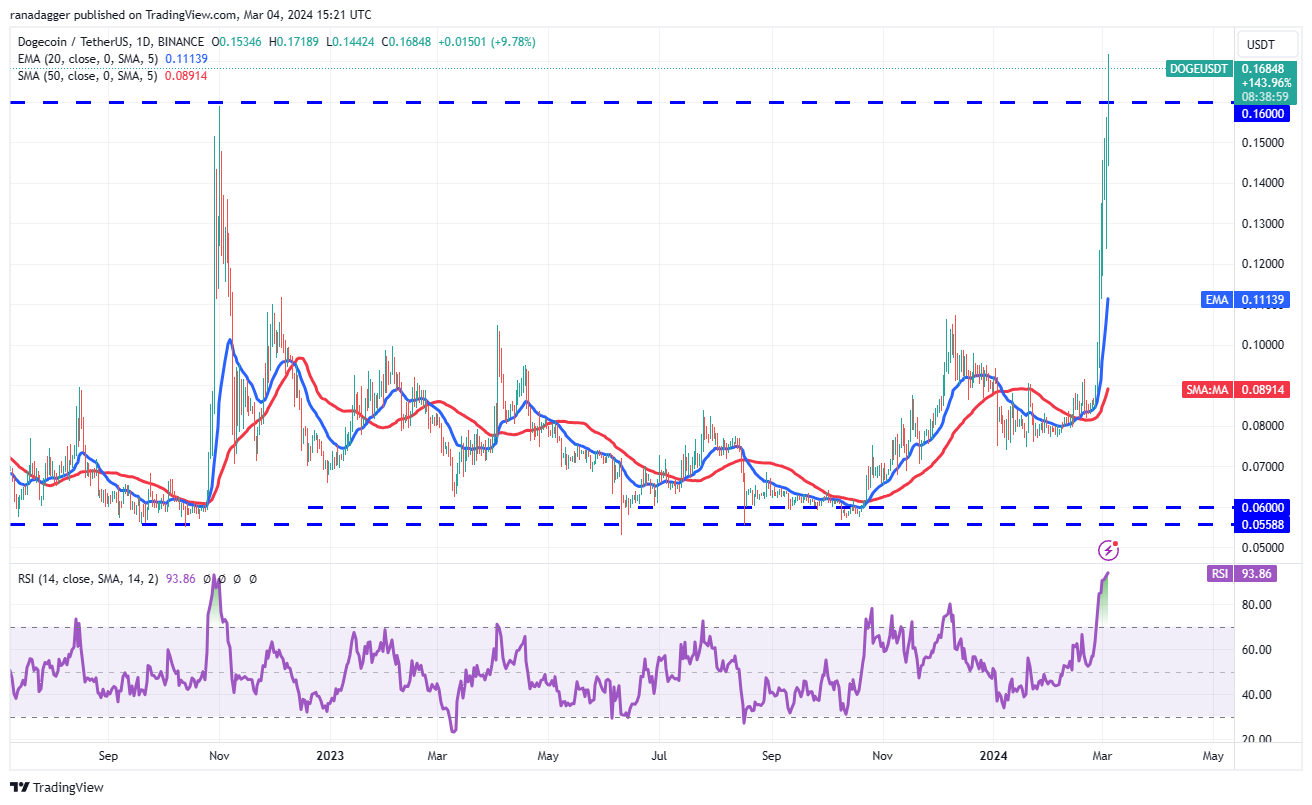
Dogecoin has been on a strong bullish run over the past few days. Bears attempted to lower the price on March 3rd, but the long tail of the candlestick indicates aggressive buying by the bulls.

Bulls continued the uptrend by pushing the DOGE/USDT pair above the general resistance of $0.16 on March 4th. This opens the door to a possible rise to $0.18 and then to $0.22. The sharp rise has sent the RSI level into the depths of the overbought zone, suggesting a consolidation or correction could be imminent.
The first support on the downside is $0.16, followed by $0.12. Breaching this support could signal the end of the uptrend.


 Cryptopolitan
 DogeHome
 crypto.ro English
 Crypto News Land
 ETHNews
 CFN
CFN U_Today
 Thecoinrepublic.com


