You can also read this news on COINTURK NEWS: Cryptocurrency Market Trends: Bitcoin Leads as Altcoins Gain Momentum
您也可以在 COINTURK NEWS 上閱讀此新聞:加密貨幣市場趨勢:隨著山寨幣獲得動力,比特幣處於領先地位
The cryptocurrency market, led by Bitcoin, continues to experience significant developments. During this period, there is a notable flow of money into the altcoin market, and many altcoin projects keep their investors happy. So, what is happening on the fronts of Solana, Cardano, and Dogecoin during this process? We examine with detailed chart analysis and key support and resistance levels.
以比特幣為首的加密貨幣市場持續經歷重大發展。在此期間,大量資金流入山寨幣市場,許多山寨幣計畫讓投資者感到高興。那麼,在此過程中 Solana、Cardano 和 Dogecoin 的正面發生了什麼?我們透過詳細的圖表分析以及關鍵支撐位和阻力位進行檢查。
Solana Chart Analysis
Solana 圖表分析
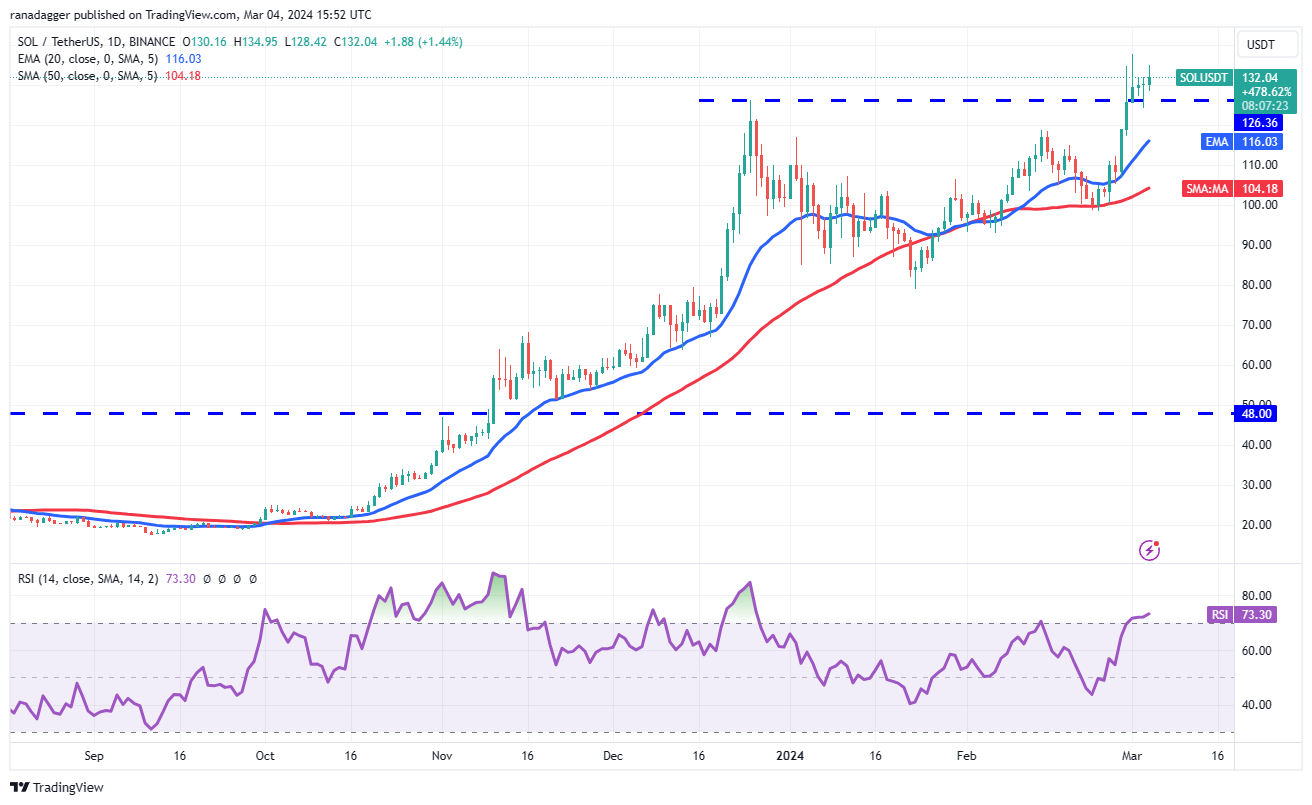
Solana closed above the $126 resistance on March 1st, but bulls are struggling to maintain momentum. This indicates a lack of demand at higher levels. If the price remains above $126, the likelihood of a renewed uptrend increases. If buyers surpass the $138 level, the SOL/USDT pair is likely to rise to $143 and then to $158.
Solana 於 3 月 1 日收於 126 美元阻力位之上,但多頭正在努力維持勢頭。這表明缺乏更高水準的需求。如果價格維持在 126 美元以上,重新出現上升趨勢的可能性就會增加。如果買家突破 138 美元的水平,SOL/USDT 貨幣對可能會升至 143 美元,然後升至 158 美元。

Contrary to this assumption, if the $126 level is breached, the pair could fall to the 20-day EMA average of $116. Bears will have to push the price below the 20-day EMA average to argue that the break above $126 was a false move. The pair could then drop to the 50-day SMA average of $104.
與這一假設相反,如果突破 126 美元水平,該貨幣對可能會跌至 20 日均線 116 美元。空頭必須將價格推至 20 日均線下方,才能證明突破 126 美元是錯誤走勢。隨後該貨幣對可能會跌至 50 日移動平均線 104 美元。
Cardano Chart Analysis
卡爾達諾圖表分析
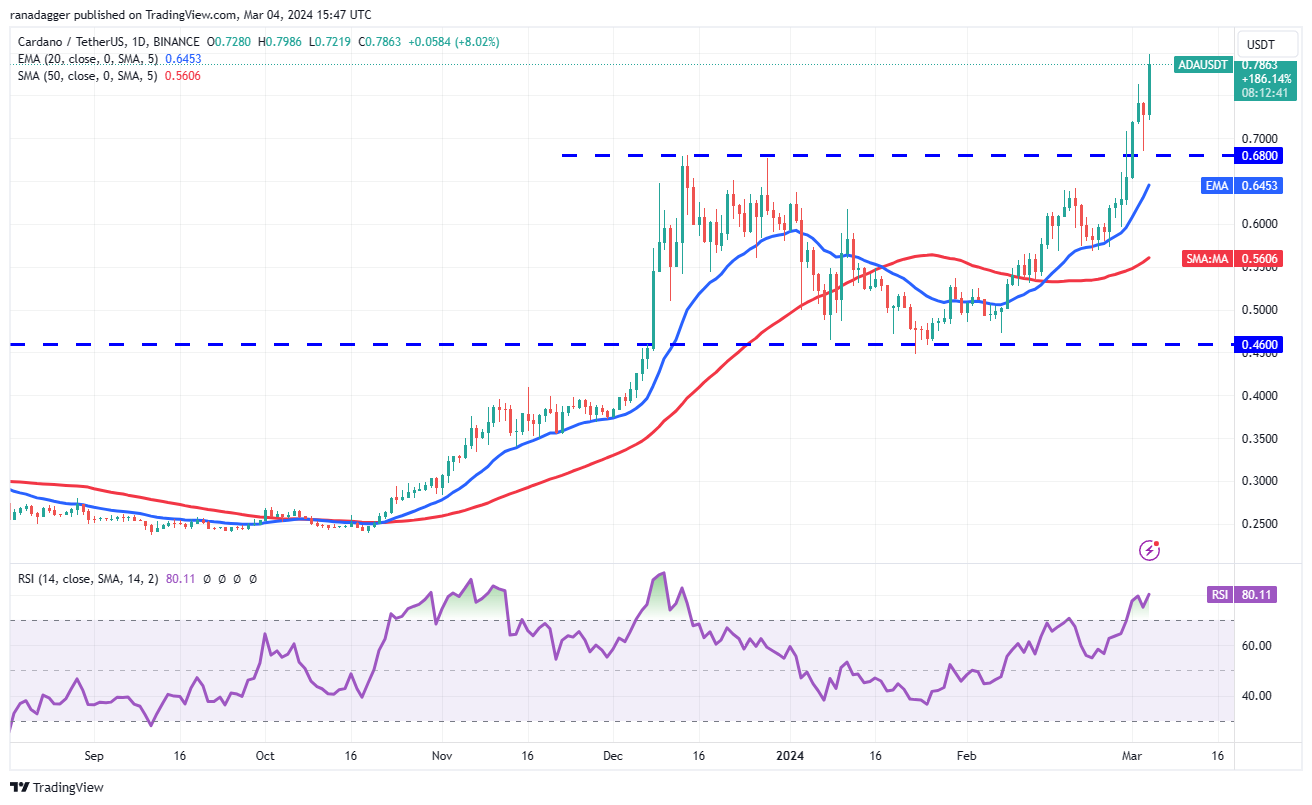
Cardano started the next leg of its uptrend after buyers overcame the $0.68 resistance on March 1st. Bears tried to pull the price below the breakout level on March 3rd, but bulls held their ground. This shows strong buying on dips.
在買家於 3 月 1 日克服 0.68 美元的阻力位後,卡爾達諾開始了下一階段的上升趨勢。空頭試圖將價格拉低至 3 月 3 日的突破水平以下,但多頭堅守陣地。這顯示逢低買盤強勁。

The upward move is expected to reach $0.90, where bears are likely to mount a strong defense. If momentum remains strong and buyers push towards $0.90, the rise could extend to $1.25. Bulls may struggle to surpass this level.
預計上漲將達到 0.90 美元,空頭可能會在此進行強有力的防禦。如果勢頭依然強勁且買家推向 0.90 美元,則漲幅可能會擴大至 1.25 美元。多頭可能很難超越這個層次。
The RSI level has risen above 80, indicating the rally may be at risk of stalling. The 20-day EMA average of $0.64 continues to be the key support to watch on the downside. A break and close below this level would signal the bulls losing control. The ADA/USDT pair could then fall to the 50-day SMA average of $0.56.
RSI水準已升至80以上,顯示漲勢可能面臨停滯風險。 20 日均線 0.64 美元仍然是下行方向值得關注的關鍵支撐。突破並收盤低於該水平將標誌著多頭失去控制。 ADA/USDT 貨幣對可能會跌至 0.56 美元的 50 日移動平均線均線。
Dogecoin Chart Analysis
狗狗幣圖表分析
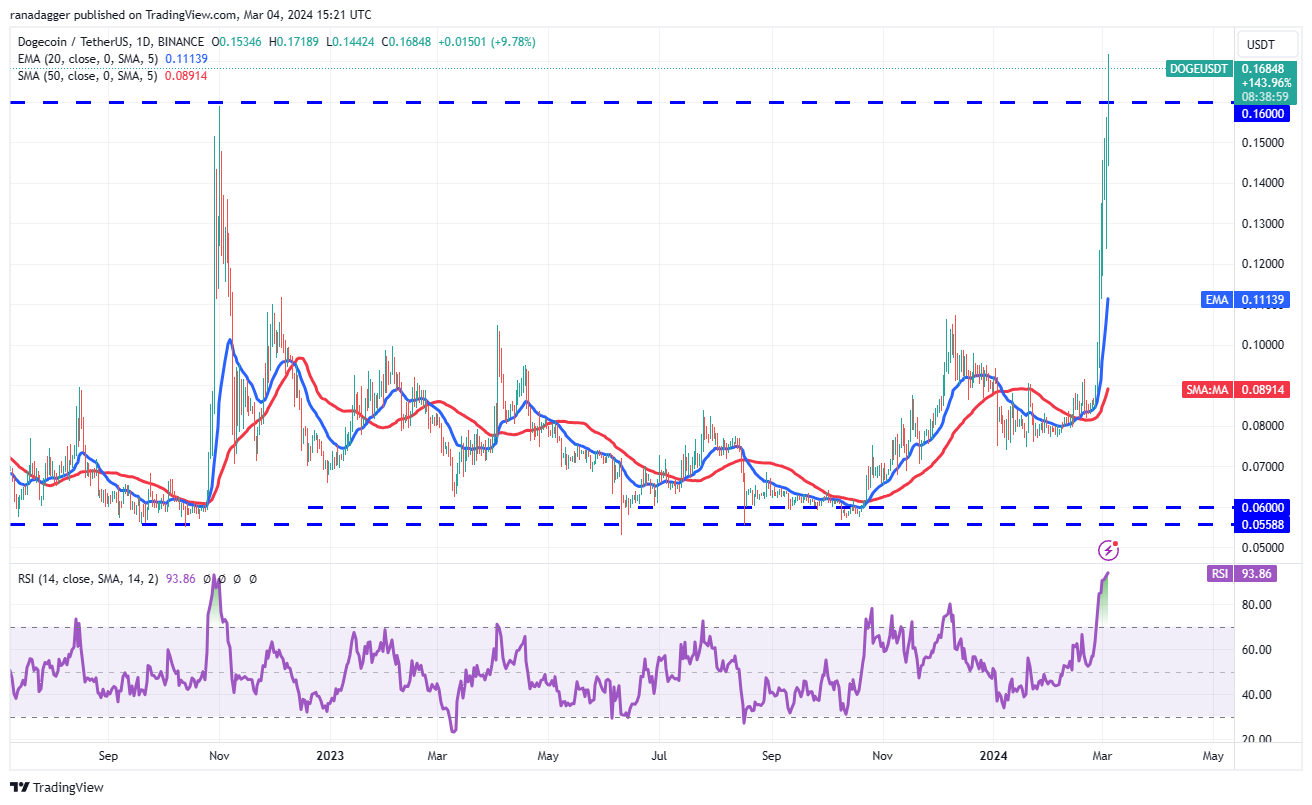
Dogecoin has been on a strong bullish run over the past few days. Bears attempted to lower the price on March 3rd, but the long tail of the candlestick indicates aggressive buying by the bulls.
過去幾天,狗狗幣一直處於強勁的看漲走勢。 3 月 3 日,空頭試圖降低價格,但燭台的長尾顯示多頭積極買盤。

Bulls continued the uptrend by pushing the DOGE/USDT pair above the general resistance of $0.16 on March 4th. This opens the door to a possible rise to $0.18 and then to $0.22. The sharp rise has sent the RSI level into the depths of the overbought zone, suggesting a consolidation or correction could be imminent.
3 月 4 日,多頭將 DOGE/USDT 貨幣對推升至 0.16 美元的整體阻力位上方,延續了上升趨勢。這為價格可能上漲至 0.18 美元,然後上漲至 0.22 美元打開了大門。急劇上漲已使 RSI 水平進入超買區域的深處,表明盤整或調整可能即將到來。
The first support on the downside is $0.16, followed by $0.12. Breaching this support could signal the end of the uptrend.
下行的第一個支撐位是 0.16 美元,其次是 0.12 美元。突破該支撐位可能標誌著上升趨勢的結束。
The post first appeared on COINTURK NEWS: Cryptocurrency Market Trends: Bitcoin Leads as Altcoins Gain Momentum
該帖子首次出現在 COINTURK 新聞上:加密貨幣市場趨勢:山寨幣勢頭強勁,比特幣領先


 Thecryptoupdates
 The Bit Journal
 Times Tabloid
 CoinoMedia
 U_Today
 ETHNews
 crypto.news
 CoinPedia News
 CoinoMedia


