You can also read this news on COINTURK NEWS: Cryptocurrency Market Trends: Bitcoin Leads as Altcoins Gain Momentum
このニュースは COINTURK NEWS でも読むことができます: 暗号通貨市場の動向: アルトコインが勢いを増すにつれてビットコインがリード
The cryptocurrency market, led by Bitcoin, continues to experience significant developments. During this period, there is a notable flow of money into the altcoin market, and many altcoin projects keep their investors happy. So, what is happening on the fronts of Solana, Cardano, and Dogecoin during this process? We examine with detailed chart analysis and key support and resistance levels.
ビットコインを筆頭に仮想通貨市場は大きな発展を続けています。この期間中、アルトコイン市場への資金の流れは顕著であり、多くのアルトコイン プロジェクトは投資家を満足させています。では、このプロセス中に、Solana、Cardano、Dogecoin の最前線で何が起こっているのでしょうか?詳細なチャート分析と主要なサポートとレジスタンスのレベルを調査します。
Solana Chart Analysis
ソラナチャート分析
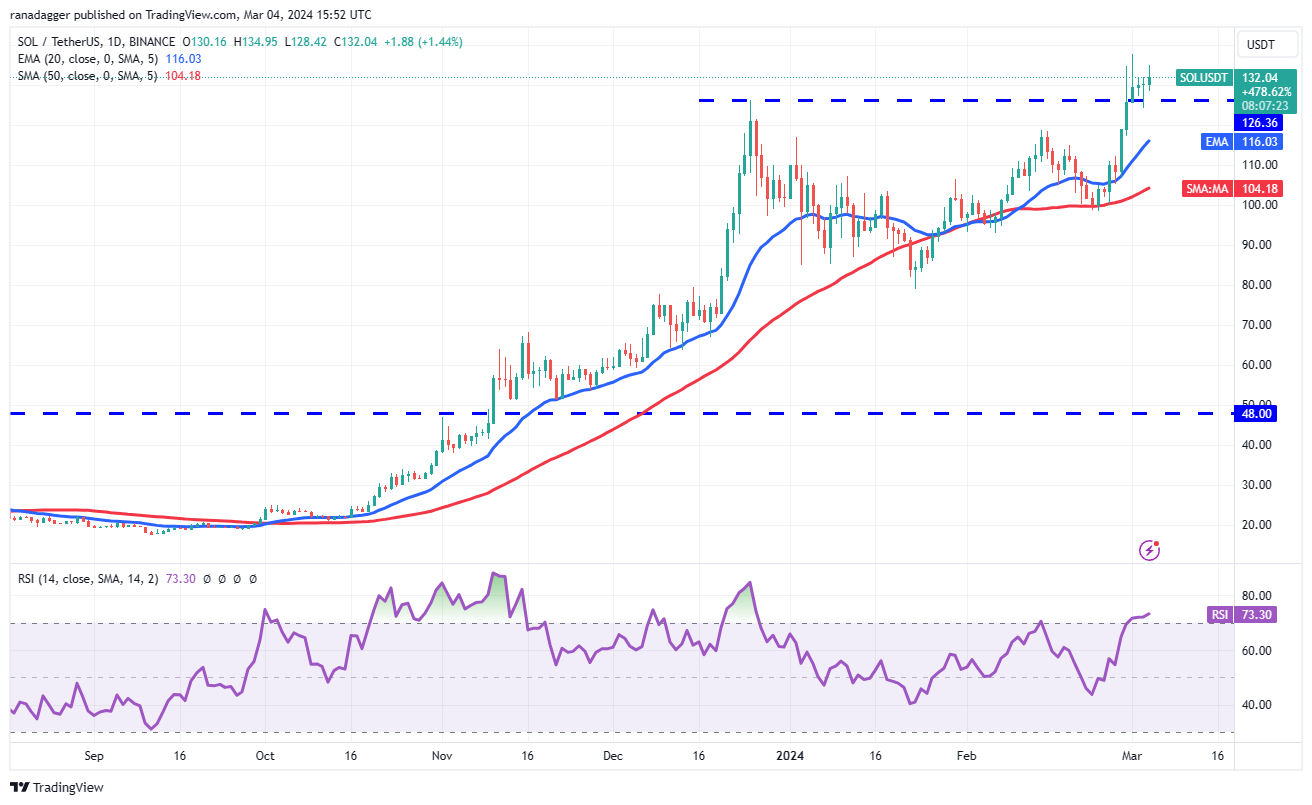
Solana closed above the $126 resistance on March 1st, but bulls are struggling to maintain momentum. This indicates a lack of demand at higher levels. If the price remains above $126, the likelihood of a renewed uptrend increases. If buyers surpass the $138 level, the SOL/USDT pair is likely to rise to $143 and then to $158.
ソラナは3月1日に126ドルの抵抗線を上回って取引を終えたが、強気派は勢いを維持するのに苦労している。これは、より高いレベルでの需要が不足していることを示しています。価格が126ドルを超えたままであれば、新たな上昇トレンドの可能性が高まります。買い手が138ドルの水準を超えた場合、SOL/USDTペアは143ドルに上昇し、その後158ドルに上昇する可能性がある。

Contrary to this assumption, if the $126 level is breached, the pair could fall to the 20-day EMA average of $116. Bears will have to push the price below the 20-day EMA average to argue that the break above $126 was a false move. The pair could then drop to the 50-day SMA average of $104.
この想定に反して、126 ドルのレベルを突破した場合、ペアは 20 日間 EMA 平均の 116 ドルまで下落する可能性があります。弱気派は、126ドルを超えたことが誤った動きだったと主張するには、価格を20日間EMA平均以下に押し下げる必要があるだろう。その後、ペアは50日間のSMA平均である104ドルまで下落する可能性がある。
Cardano Chart Analysis
Cardano チャート分析
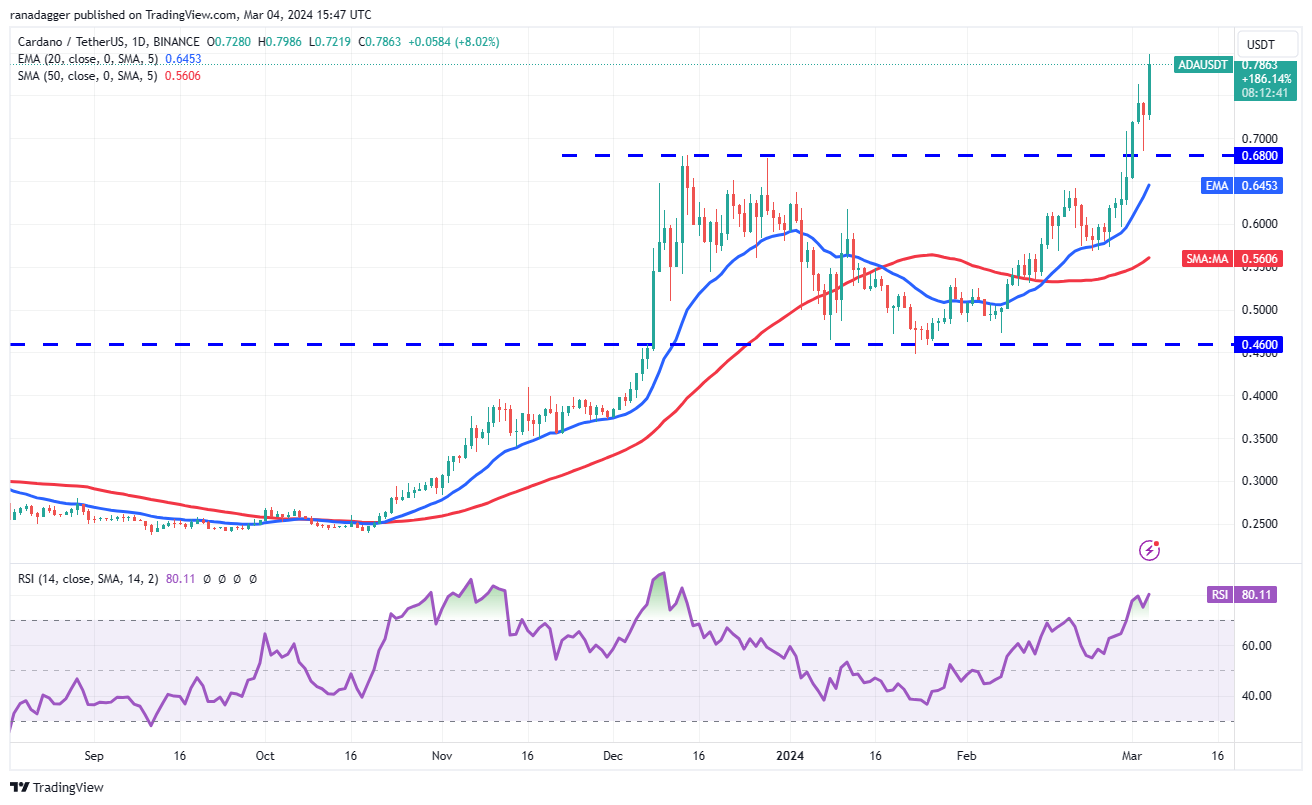
Cardano started the next leg of its uptrend after buyers overcame the $0.68 resistance on March 1st. Bears tried to pull the price below the breakout level on March 3rd, but bulls held their ground. This shows strong buying on dips.
カルダノは、買い手が3月1日に0.68ドルの抵抗を克服した後、上昇トレンドの次のレグを開始しました。弱気派は3月3日のブレイクアウトレベルよりも価格を引き下げようとしたが、強気派は踏みとどまった。これは押し目買いが強いことを示しています。

The upward move is expected to reach $0.90, where bears are likely to mount a strong defense. If momentum remains strong and buyers push towards $0.90, the rise could extend to $1.25. Bulls may struggle to surpass this level.
上昇幅は0.90ドルに達すると予想されており、弱気派は強力な防御を仕掛ける可能性が高い。勢いが引き続き強く、買い手が0.90ドルに向けて押し上げれば、上昇幅は1.25ドルにまで拡大する可能性がある。強気派はこのレベルを超えるのに苦労するかもしれない。
The RSI level has risen above 80, indicating the rally may be at risk of stalling. The 20-day EMA average of $0.64 continues to be the key support to watch on the downside. A break and close below this level would signal the bulls losing control. The ADA/USDT pair could then fall to the 50-day SMA average of $0.56.
RSI水準は80を超えており、上昇相場が失速するリスクがあることを示している。 20日間EMA平均の0.64ドルが引き続き下値に注目すべき重要なサポートとなる。このレベルを下回るブレイクとクローズは、強気派がコントロールを失うことを示すでしょう。その後、ADA/USDTペアは50日間SMA平均の0.56ドルまで下落する可能性がある。
Dogecoin Chart Analysis
ドージコインチャート分析
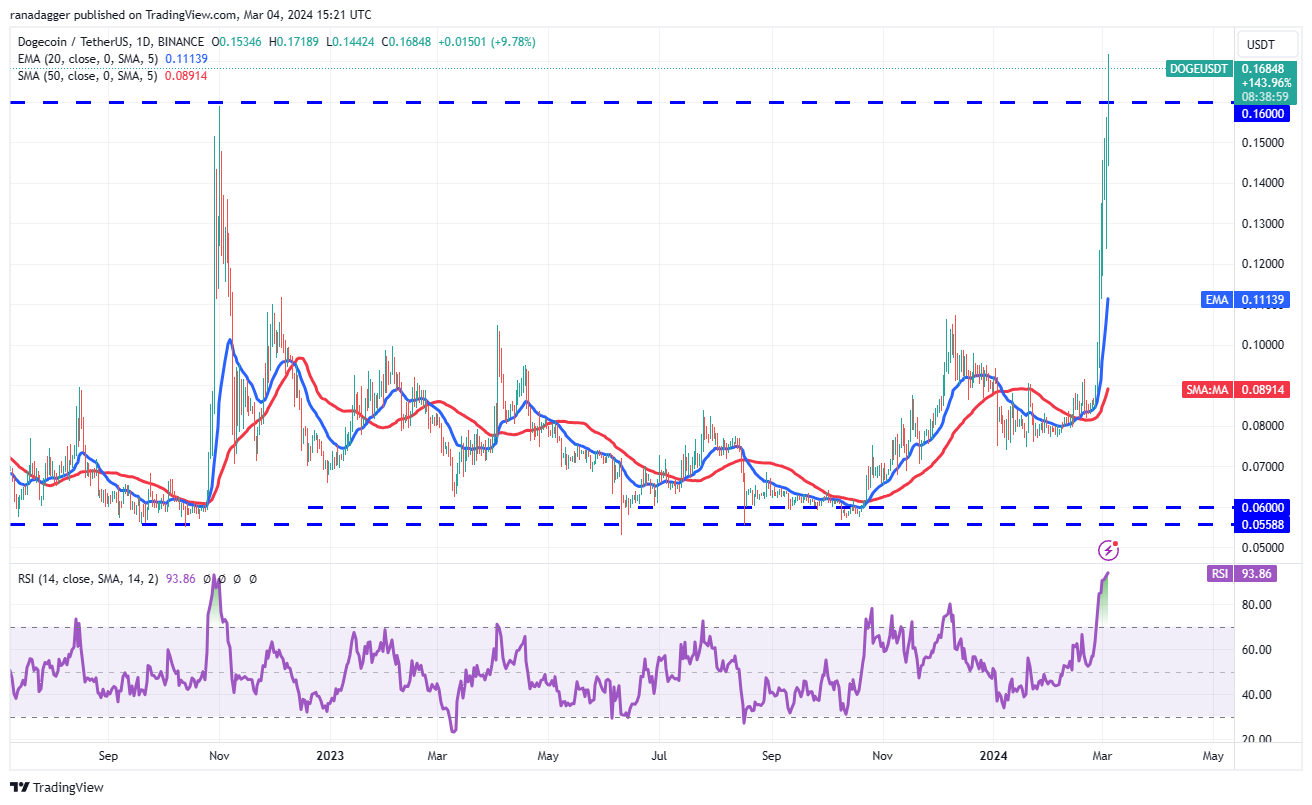
Dogecoin has been on a strong bullish run over the past few days. Bears attempted to lower the price on March 3rd, but the long tail of the candlestick indicates aggressive buying by the bulls.
ドージコインはここ数日間、力強い強気相場を続けている。弱気派は3月3日に価格を下げようとしたが、ローソク足の長い尾は強気派の積極的な買いを示している。

Bulls continued the uptrend by pushing the DOGE/USDT pair above the general resistance of $0.16 on March 4th. This opens the door to a possible rise to $0.18 and then to $0.22. The sharp rise has sent the RSI level into the depths of the overbought zone, suggesting a consolidation or correction could be imminent.
強気派は3月4日のDOGE/USDTペアを一般的な抵抗線である0.16ドルを上回って上昇トレンドを継続した。これにより、0.18ドル、さらに0.22ドルへの上昇の可能性が開かれます。急激な上昇によりRSIレベルは買われ過ぎゾーンの深部にまで落ち込んでおり、値固めや調整が差し迫っている可能性があることを示唆している。
The first support on the downside is $0.16, followed by $0.12. Breaching this support could signal the end of the uptrend.
下値の最初のサポートは 0.16 ドルで、次に 0.12 ドルです。このサポートを突破すると、上昇トレンドの終わりを告げる可能性があります。
The post first appeared on COINTURK NEWS: Cryptocurrency Market Trends: Bitcoin Leads as Altcoins Gain Momentum
この投稿は COINTURK NEWS に最初に掲載されました: 暗号通貨市場の動向: アルトコインが勢いを増すにつれてビットコインがリード


 Thecryptoupdates
 The Bit Journal
 Times Tabloid
 CoinoMedia
 U_Today
 ETHNews
 crypto.news
 CoinPedia News
 CoinoMedia


