Dogecoin Eyes Key Triangle Pattern for Next Price Move

Dogecoin price| Tradingview
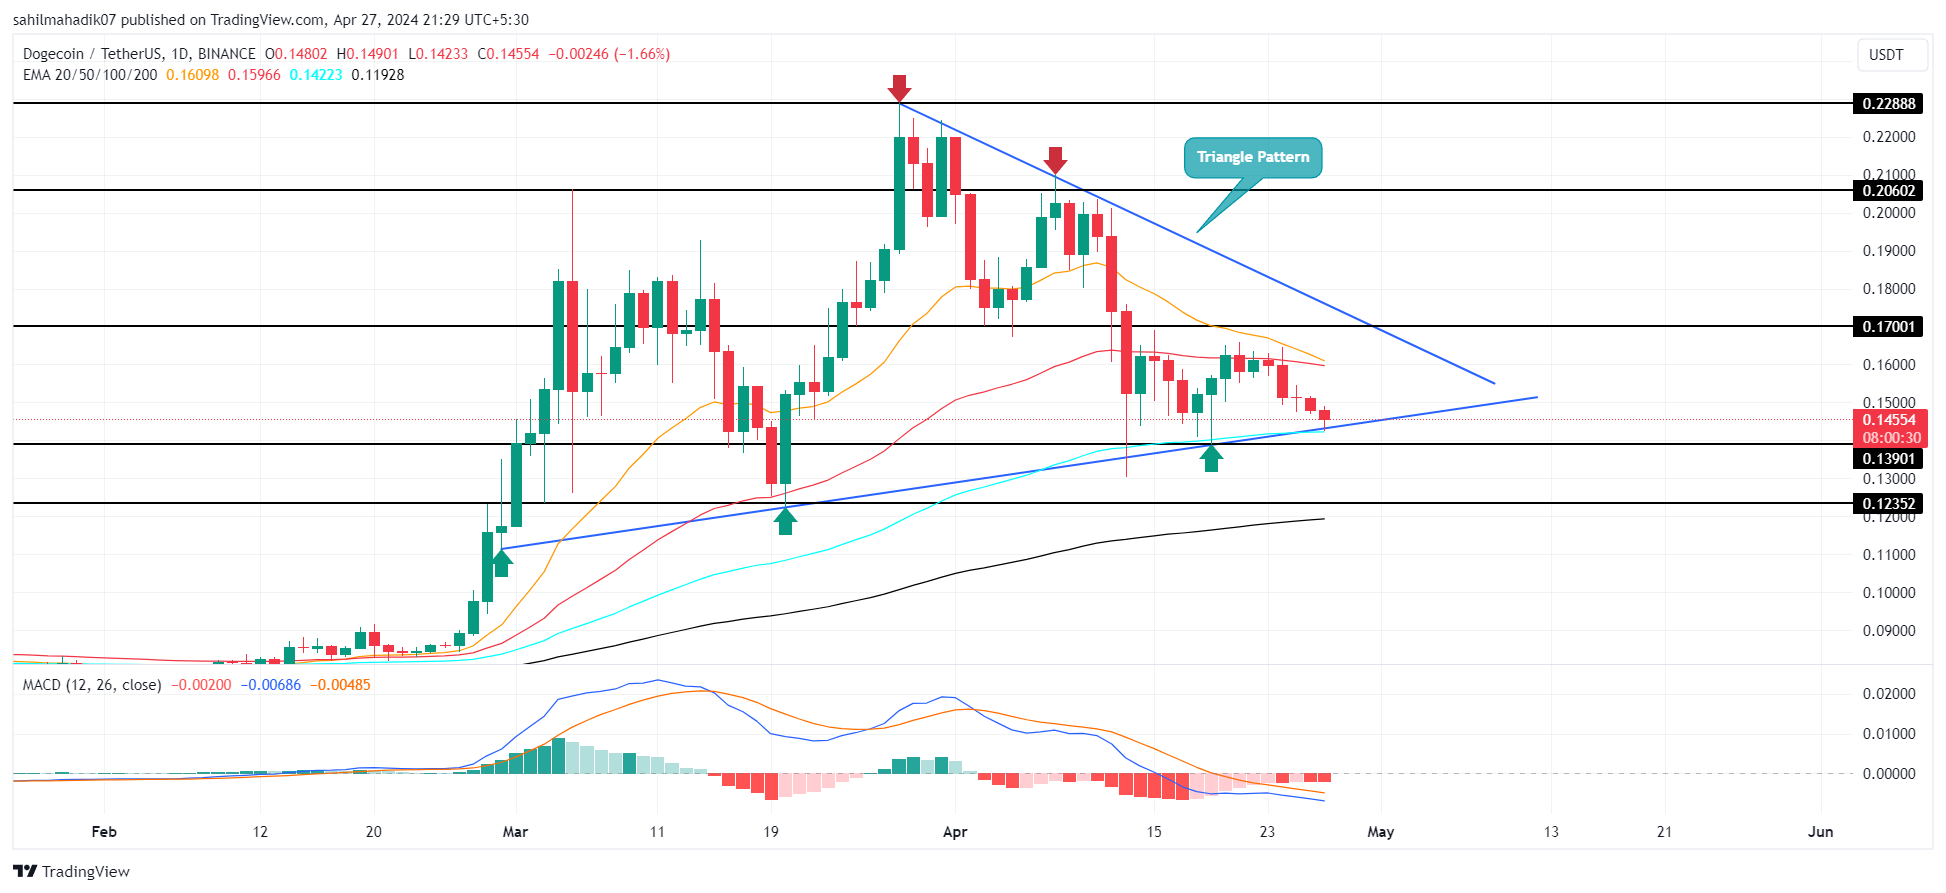
DOGE, the largest meme cryptocurrency by market capitalization, has experienced a significant decline this week amidst Bitcoin's post-halving correction. Dogecoin has fallen for five consecutive days, dropping from a high of $0.164 to $0.146, marking an 11.17% loss. However, the asset price is currently retesting crucial monthly support of the triangle pattern, indicating a potential reversal.
Support at $0.145: A Sign of a New Rally?
For nearly two months, Dogecoin has traded sideways within a symmetrical triangle pattern formed by two converging trendlines on the daily chart. These trendlines have acted as dynamic resistance and support.
Currently, DOGE is trading at $0.145 and has encountered demand pressure at the triangle's lower trendline, as evidenced by a long-tailed rejection candle. The asset has a history of bouncing back from this support level, suggesting a high area of interest for buyers.
Divergence in Wallet Activity
According to a recent analysis by Santiment, there is a notable divergence in the activity of cryptocurrency wallets. The data shows that the total number of active non-empty Bitcoin wallets is increasing, indicating growing interest in Bitcoin despite its price volatility.
 The total amount of non-empty #Bitcoin wallets are rapidly growing despite choppy prices. #Altcoin wallets for assets like #Dogecoin have flattened after enormous rises earlier this year. #Cardano is one of the few networks to see active wallets drop. https://t.co/itg9qMes7c pic.twitter.com/yrOlEQw3jy — Santiment (@santimentfeed) April 27, 2024
In contrast, altcoin wallets for assets like Dogecoin have seen a plateau in activity after significant increases earlier in the year. This trend may signal a shift in investor behavior, with traders seeking stability in less volatile coins during uncertain market conditions.
Consolidation and Potential Breakout
DOGE is expected to continue its consolidation for several days or weeks as the triangle pattern develops. For the memecoin to enter a directional trend, buyers must break out from either of the triangle's trendlines. A breakout from the upper boundary would accelerate buying momentum and push the asset above $0.2.
Technical Indicators
- Bollinger Bands: The downtick in the lower boundary of the Bollinger band indicator suggests that sellers remain aggressive.
- Moving Average Convergence Divergence (MACD): A bearish reversal from the MACD and signal line indicates no sign of reversal yet.


 DogeHome
 Optimisus
 Crypto News Land
 Optimisus
 Cryptopolitan_News
 Cryptopolitan


