Dogecoin Eyes Key Triangle Pattern for Next Price Move
Dogecoin Eyes 다음 가격 움직임에 대한 주요 삼각형 패턴
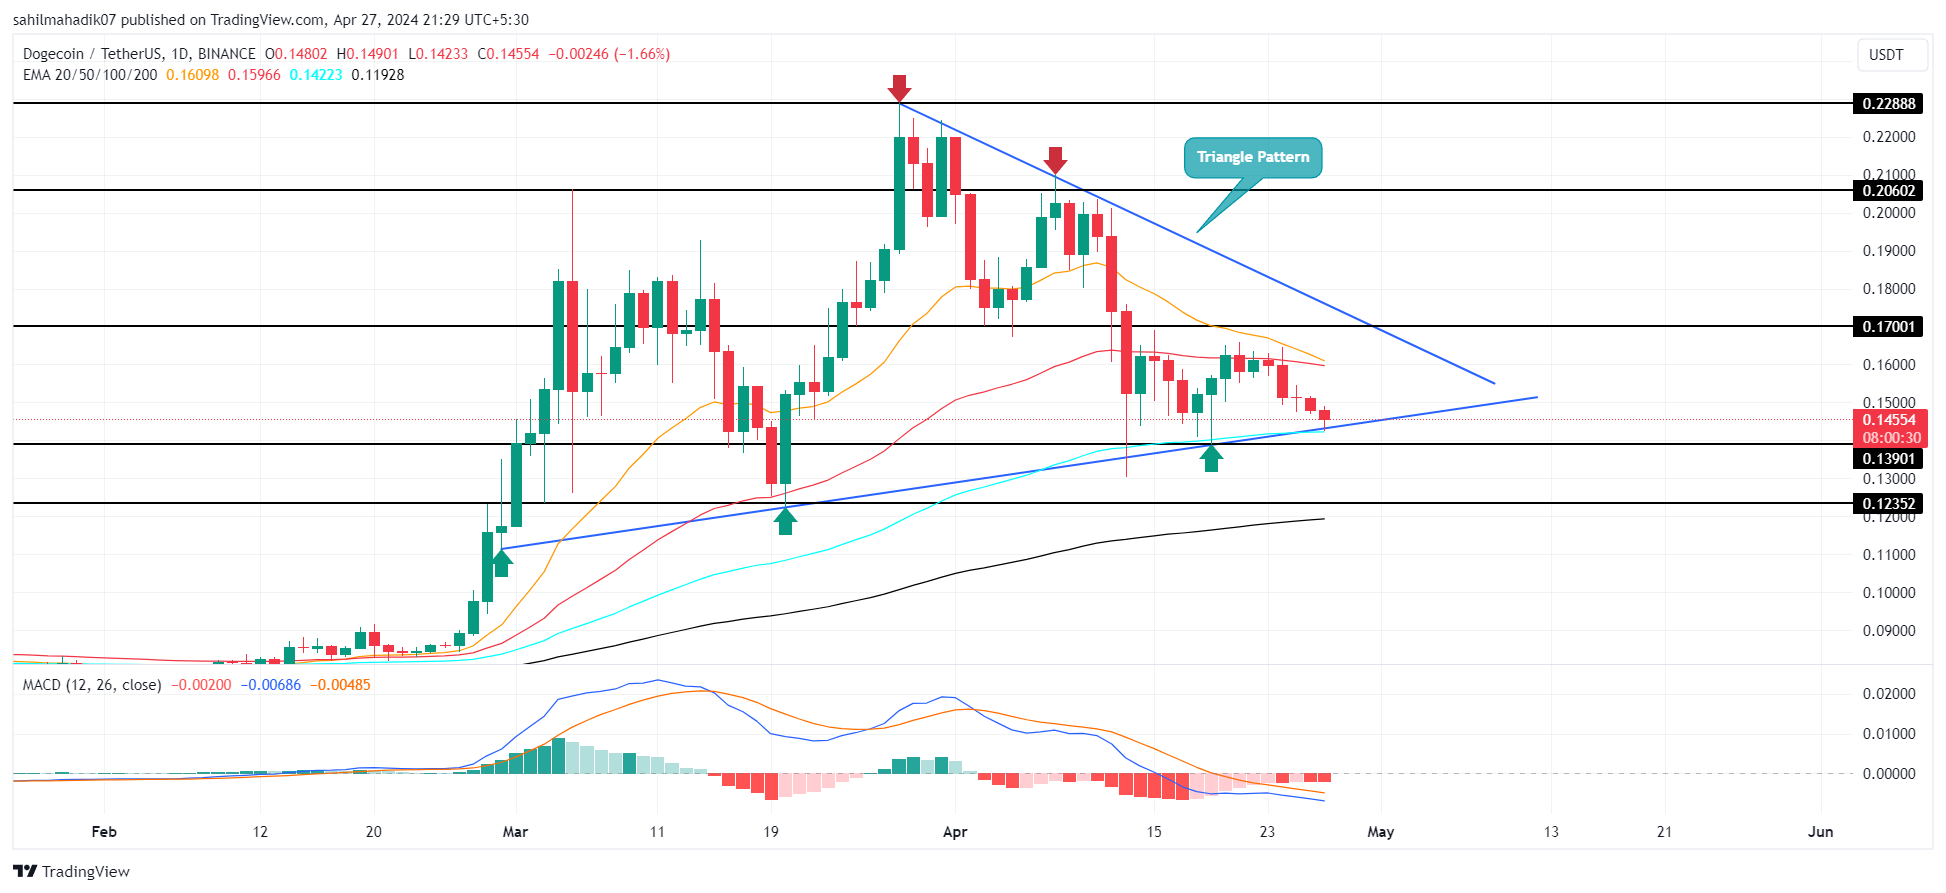
Dogecoin price| Tradingview
도지코인 가격| 트레이딩뷰
DOGE, the largest meme cryptocurrency by market capitalization, has experienced a significant decline this week amidst Bitcoin's post-halving correction. Dogecoin has fallen for five consecutive days, dropping from a high of $0.164 to $0.146, marking an 11.17% loss. However, the asset price is currently retesting crucial monthly support of the triangle pattern, indicating a potential reversal.
시가총액 기준으로 가장 큰 밈 암호화폐인 DOGE는 비트코인의 반감기 조정으로 인해 이번 주에 상당한 하락을 경험했습니다. Dogecoin은 5일 연속 하락하여 최고 $0.164에서 $0.146으로 하락하여 11.17%의 손실을 기록했습니다. 그러나 자산 가격은 현재 삼각형 패턴의 중요한 월별 지지를 다시 테스트하고 있어 반전 가능성이 있음을 나타냅니다.
Support at $0.145: A Sign of a New Rally?
0.145달러 지지: 새로운 반등의 조짐?
For nearly two months, Dogecoin has traded sideways within a symmetrical triangle pattern formed by two converging trendlines on the daily chart. These trendlines have acted as dynamic resistance and support.
거의 두 달 동안 Dogecoin은 일일 차트에서 두 개의 수렴 추세선으로 형성된 대칭 삼각형 패턴 내에서 옆으로 거래되었습니다. 이러한 추세선은 동적 저항과 지지 역할을 해왔습니다.
Currently, DOGE is trading at $0.145 and has encountered demand pressure at the triangle's lower trendline, as evidenced by a long-tailed rejection candle. The asset has a history of bouncing back from this support level, suggesting a high area of interest for buyers.
현재 DOGE는 $0.145에 거래되고 있으며 긴 꼬리의 거부 캔들에서 알 수 있듯이 삼각형의 하단 추세선에서 수요 압력을 받고 있습니다. 자산에는 이 지원 수준에서 회복된 이력이 있어 구매자의 관심 분야가 높다는 것을 암시합니다.
Divergence in Wallet Activity
지갑 활동의 차이
According to a recent analysis by Santiment, there is a notable divergence in the activity of cryptocurrency wallets. The data shows that the total number of active non-empty Bitcoin wallets is increasing, indicating growing interest in Bitcoin despite its price volatility.
Santiment의 최근 분석에 따르면 암호화폐 지갑의 활동에는 눈에 띄는 차이가 있습니다. 데이터에 따르면 비어 있지 않은 활성 비트코인 지갑의 총 수가 증가하고 있으며 이는 가격 변동성에도 불구하고 비트코인에 대한 관심이 높아지고 있음을 나타냅니다.
 The total amount of non-empty #Bitcoin wallets are rapidly growing despite choppy prices. #Altcoin wallets for assets like #Dogecoin have flattened after enormous rises earlier this year. #Cardano is one of the few networks to see active wallets drop. https://t.co/itg9qMes7c pic.twitter.com/yrOlEQw3jy — Santiment (@santimentfeed) April 27, 2024
비어 있지 않은 #비트코인 지갑의 총량이 고르지 못한 가격에도 불구하고 빠르게 증가하고 있습니다. #Dogecoin과 같은 자산을 위한 #Altcoin 지갑은 올해 초 엄청난 상승 이후 평탄해졌습니다. #Cardano는 활성 지갑이 사라지는 몇 안 되는 네트워크 중 하나입니다. https://t.co/itg9qMes7c pic.twitter.com/yrOlEQw3jy — Santiment(@santimentfeed) 2024년 4월 27일
In contrast, altcoin wallets for assets like Dogecoin have seen a plateau in activity after significant increases earlier in the year. This trend may signal a shift in investor behavior, with traders seeking stability in less volatile coins during uncertain market conditions.
대조적으로, Dogecoin과 같은 자산을 위한 알트코인 지갑은 올해 초 상당한 증가를 보인 후 활동이 정체되는 모습을 보였습니다. 이러한 추세는 불확실한 시장 상황에서 변동성이 적은 코인의 안정성을 추구하는 거래자들과 함께 투자자 행동의 변화를 나타낼 수 있습니다.
Consolidation and Potential Breakout
통합 및 잠재적 돌파
DOGE is expected to continue its consolidation for several days or weeks as the triangle pattern develops. For the memecoin to enter a directional trend, buyers must break out from either of the triangle's trendlines. A breakout from the upper boundary would accelerate buying momentum and push the asset above $0.2.
DOGE는 삼각형 패턴이 발전함에 따라 며칠 또는 몇 주 동안 통합을 계속할 것으로 예상됩니다. Memecoin이 방향성 추세에 진입하려면 구매자는 삼각형의 추세선 중 하나에서 벗어나야 합니다. 상한선을 돌파하면 매수 모멘텀이 가속화되고 자산이 0.2달러 이상으로 올라갑니다.
Technical Indicators
기술 지표
- Bollinger Bands: The downtick in the lower boundary of the Bollinger band indicator suggests that sellers remain aggressive.
- Moving Average Convergence Divergence (MACD): A bearish reversal from the MACD and signal line indicates no sign of reversal yet.
볼린저 밴드(Bollinger Bands): 볼린저 밴드 지표 하단 경계의 하락세는 판매자가 여전히 공격적임을 나타냅니다. MACD(Moving Average Convergence Divergence): MACD 및 신호선의 약세 반전은 아직 반전 조짐이 없음을 나타냅니다.


 DogeHome
 TheCoinrise Media
 TheCoinrise Media
 DogeHome
 Crypto Daily™
 U_Today
 Coinstelegram
 FrankNez
 DogeHome


