Dogecoin Eyes Key Triangle Pattern for Next Price Move
ドージコインは次の価格変動に向けて重要な三角形のパターンを狙う

Dogecoin price| Tradingview
ドージコイン価格|トレーディングビュー
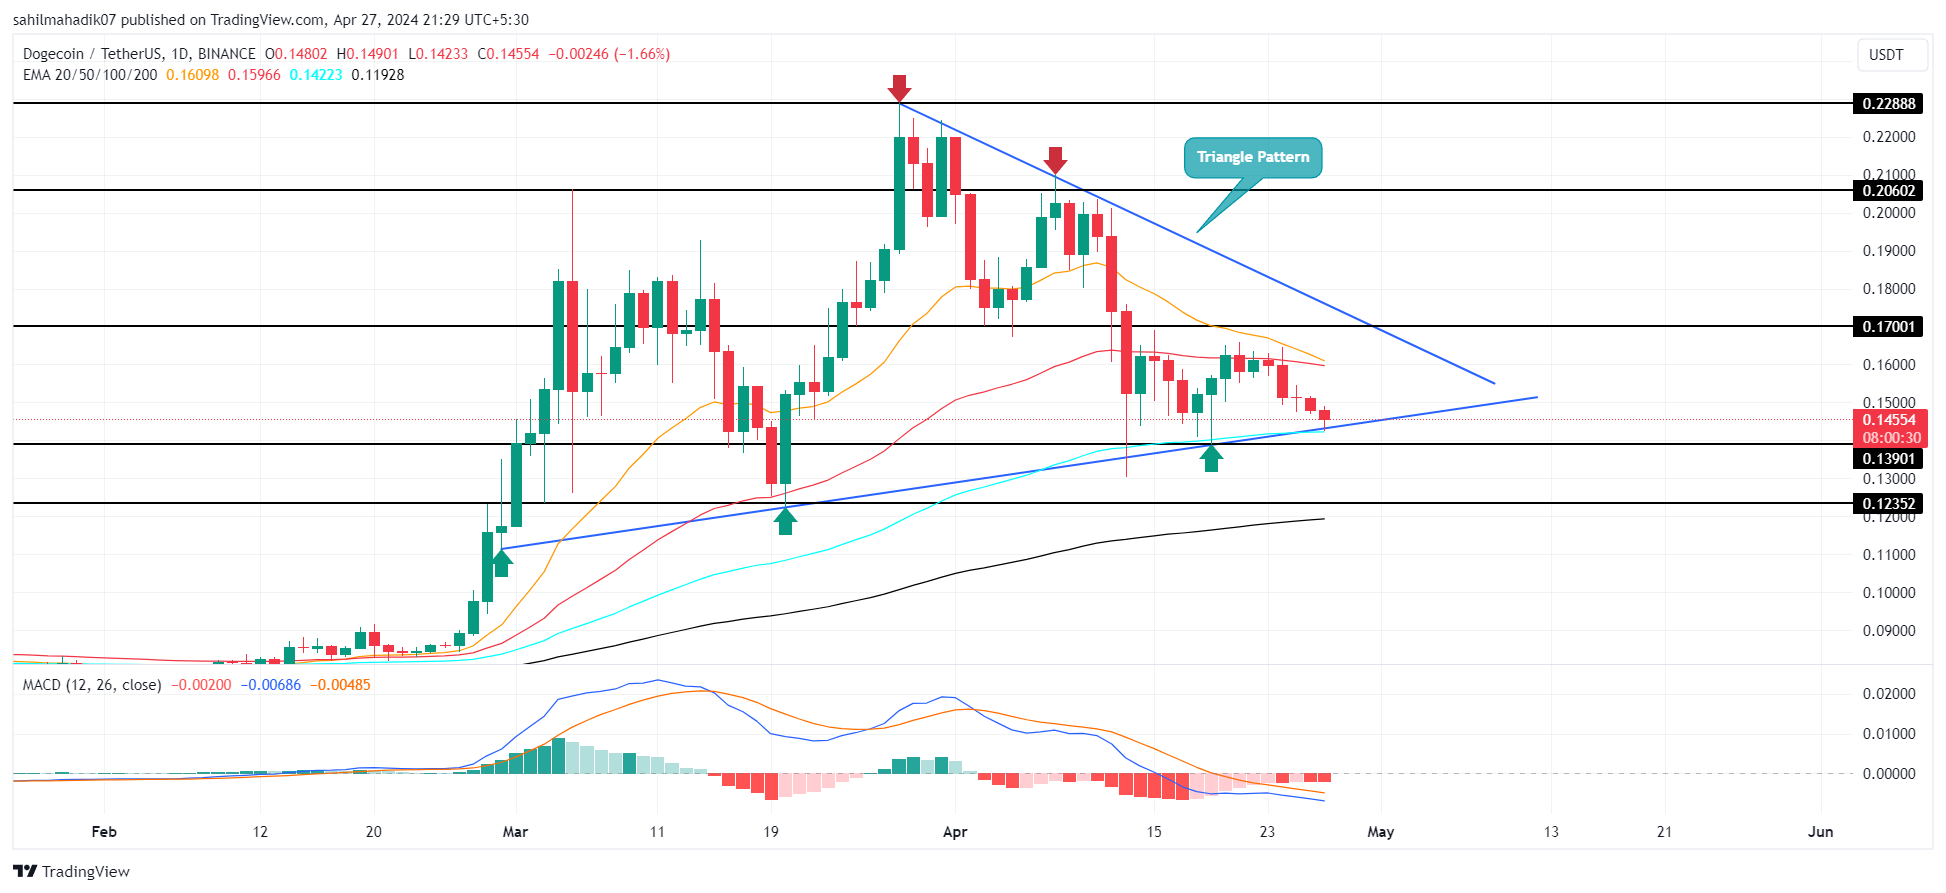
DOGE, the largest meme cryptocurrency by market capitalization, has experienced a significant decline this week amidst Bitcoin's post-halving correction. Dogecoin has fallen for five consecutive days, dropping from a high of $0.164 to $0.146, marking an 11.17% loss. However, the asset price is currently retesting crucial monthly support of the triangle pattern, indicating a potential reversal.
時価総額で最大のミーム暗号通貨であるDOGEは、ビットコインの半減期後の調整のさなか、今週大幅な下落を経験した。ドージコインは5日連続で下落し、高値の0.164ドルから0.146ドルまで下落し、11.17%の損失を記録した。しかし、資産価格は現在、三角形パターンの重要な月次サポートを再テストしており、反転の可能性を示しています。
Support at $0.145: A Sign of a New Rally?
0.145ドルのサポート:新たな上昇の兆し?
For nearly two months, Dogecoin has traded sideways within a symmetrical triangle pattern formed by two converging trendlines on the daily chart. These trendlines have acted as dynamic resistance and support.
約2か月間、ドージコインは日足チャート上の2つの収束するトレンドラインによって形成される対称的な三角形パターン内で横向きに取引されてきました。これらのトレンドラインは動的抵抗線と支持線として機能しました。
Currently, DOGE is trading at $0.145 and has encountered demand pressure at the triangle's lower trendline, as evidenced by a long-tailed rejection candle. The asset has a history of bouncing back from this support level, suggesting a high area of interest for buyers.
現在、DOGEは0.145ドルで取引されており、ロングテールの拒否ローソクによって証明されるように、トライアングルの下側トレンドラインで需要圧力に遭遇しています。この資産にはこのサポートレベルから反発してきた歴史があり、買い手の関心が高い分野であることを示唆しています。
Divergence in Wallet Activity
ウォレットアクティビティの相違
According to a recent analysis by Santiment, there is a notable divergence in the activity of cryptocurrency wallets. The data shows that the total number of active non-empty Bitcoin wallets is increasing, indicating growing interest in Bitcoin despite its price volatility.
Santiment による最近の分析によると、仮想通貨ウォレットの活動には顕著な相違が見られます。このデータは、アクティブで空ではないビットコインウォレットの総数が増加していることを示しており、価格の変動にもかかわらずビットコインへの関心が高まっていることを示しています。
 The total amount of non-empty #Bitcoin wallets are rapidly growing despite choppy prices. #Altcoin wallets for assets like #Dogecoin have flattened after enormous rises earlier this year. #Cardano is one of the few networks to see active wallets drop. https://t.co/itg9qMes7c pic.twitter.com/yrOlEQw3jy — Santiment (@santimentfeed) April 27, 2024
価格が不安定であるにもかかわらず、空ではない #Bitcoin ウォレットの総量は急速に増加しています。 #Dogecoin などの資産の #Altcoin ウォレットは、今年初めの大幅な上昇の後、横ばいになりました。 #Cardano は、アクティブなウォレットがドロップされる数少ないネットワークの 1 つです。 https://t.co/itg9qMes7c pic.twitter.com/yrOlEQw3jy — サンティメント (@santimentfeed) 2024 年 4 月 27 日
In contrast, altcoin wallets for assets like Dogecoin have seen a plateau in activity after significant increases earlier in the year. This trend may signal a shift in investor behavior, with traders seeking stability in less volatile coins during uncertain market conditions.
対照的に、ドージコインのような資産のアルトコインウォレットは、年初の大幅な増加の後、活動が頭打ちになっています。この傾向は、トレーダーが不確実な市況下で変動の少ないコインの安定性を求めるという、投資家の行動の変化を示唆している可能性があります。
Consolidation and Potential Breakout
統合とブレイクアウトの可能性
DOGE is expected to continue its consolidation for several days or weeks as the triangle pattern develops. For the memecoin to enter a directional trend, buyers must break out from either of the triangle's trendlines. A breakout from the upper boundary would accelerate buying momentum and push the asset above $0.2.
DOGE はトライアングルパターンが進展するにつれて、数日または数週間は値下がりを続けると予想されます。ミームコインが方向性トレンドに入るには、買い手は三角形のトレンドラインのいずれかから抜け出す必要があります。上限を突破すれば買いの勢いが加速し、資産価格が0.2ドルを超えるだろう。
Technical Indicators
テクニカル指標
- Bollinger Bands: The downtick in the lower boundary of the Bollinger band indicator suggests that sellers remain aggressive.
- Moving Average Convergence Divergence (MACD): A bearish reversal from the MACD and signal line indicates no sign of reversal yet.
ボリンジャーバンド: ボリンジャーバンド指標の下限の下落は、売り手が引き続き積極的であることを示唆しています。移動平均収束ダイバージェンス (MACD): MACD とシグナルラインからの弱気の反転は、まだ反転の兆候がないことを示しています。


 DogeHome
 Optimisus
 Crypto News Land
 Optimisus
 Cryptopolitan_News
 Cryptopolitan


