Cover image via U.Today
As the cryptocurrency market navigates ongoing uncertainties, traders and analysts are closely monitoring a potentially significant technical formation for Dogecoin price: a moving average crossover on its weekly chart.
The nature of the crossing will determine whether it is a bearish "death cross" or a bullish "golden cross."
A golden cross occurs when a shorter-term moving average (typically the 50-day) crosses above a longer-term moving average (such as the 200-day). This bullish signal is often interpreted as a strong indication of upward momentum and potential price increases.
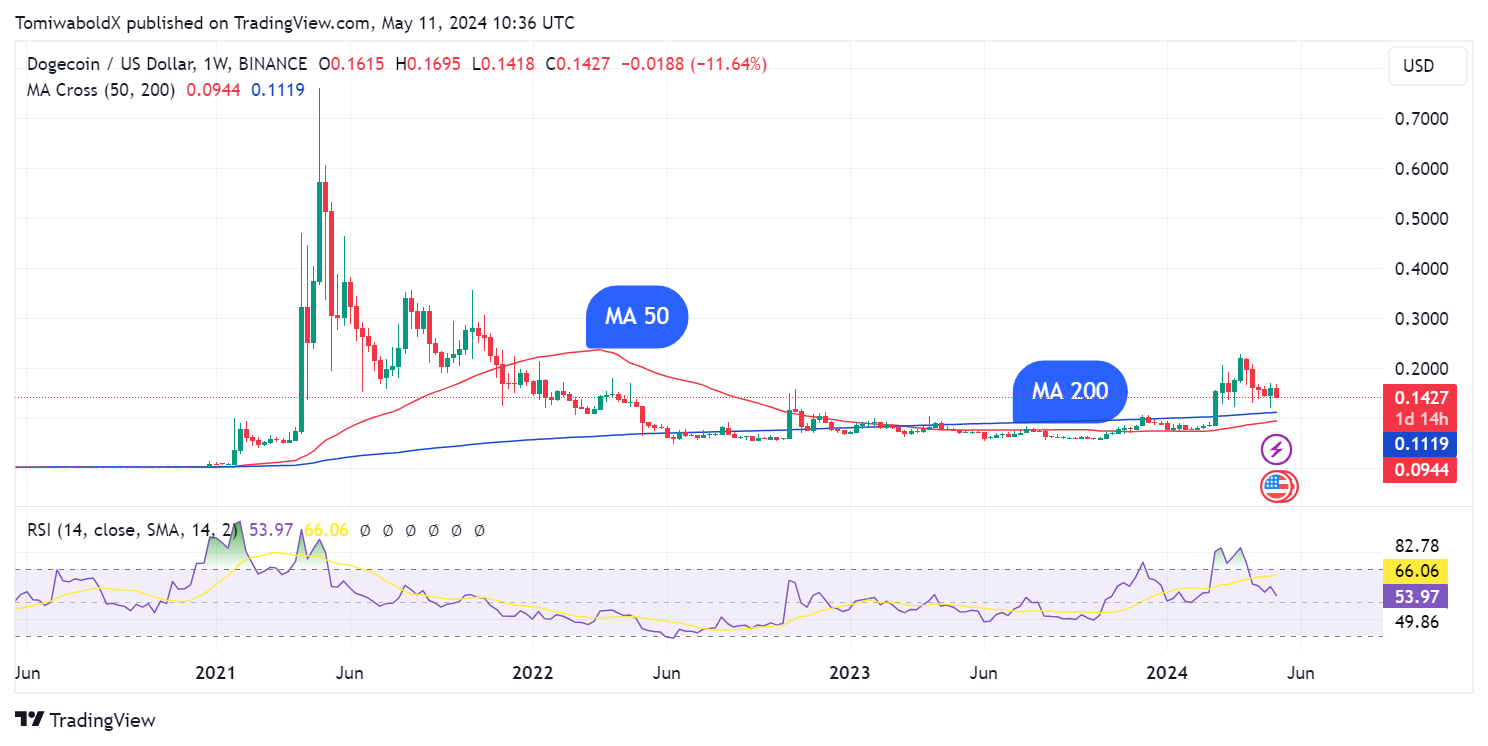
While golden crosses can occur on various time frames, a weekly golden cross holds particular significance as it reflects longer-term trends and investor sentiment.  DOGE/USD Weekly Chart, Courtesy: TradingView
In the case of Dogecoin, the 50-week SMA is rising northward and appears likely to move above the 200-week SMA, potentially resulting in a golden cross formation in the coming weeks. While expectations are in place for a golden cross, traders may need to observe the nature of the crossing to confirm it.
Dogecoin's journey toward this impending crossover has been marked by fluctuations. Following a steady decline since May 6 from highs of around $0.168, the dog-themed coin has shown resilience, finding support around the $0.142 level.
At the time of writing, Dogecoin was trading down 4.68% in the last 24 hours to $0.144 as the crypto market faced selling pressure.
Implications of a Potential Golden Cross
The last time Dogecoin witnessed a weekly golden cross was in early January 2021, resulting in an astonishing 7,996% price increase over the next four months. Dogecoin later rose to an all-time high of $0.737 on May 8, 2021.
While past performance is no guarantee of future results, the prospect of another golden cross has certainly captured the attention of the DOGE community.
For traders, the golden cross is a signal to watch closely, as it could indicate the beginning of a new uptrend. However, it is crucial to approach such indicators with caution, as they can sometimes lead to false signals, potentially trapping traders on the wrong side of the market.


 Crypto News Land
 ETHNews
 CFN
CFN U_Today
 Thecoinrepublic.com
 DogeHome
 Optimisus
 Optimisus
 DeFi Planet


