Cover image via U.Today
カバー画像(U.Today経由)
As the cryptocurrency market navigates ongoing uncertainties, traders and analysts are closely monitoring a potentially significant technical formation for Dogecoin price: a moving average crossover on its weekly chart.
仮想通貨市場が継続的な不確実性を乗り越える中、トレーダーやアナリストはドージコイン価格の潜在的に重要なテクニカル形成、つまり週足チャートの移動平均クロスオーバーを注意深く監視している。
The nature of the crossing will determine whether it is a bearish "death cross" or a bullish "golden cross."
クロスの性質によって、それが弱気の「デスクロス」か強気の「ゴールデンクロス」かが決まります。
A golden cross occurs when a shorter-term moving average (typically the 50-day) crosses above a longer-term moving average (such as the 200-day). This bullish signal is often interpreted as a strong indication of upward momentum and potential price increases.
ゴールデン クロスは、短期移動平均 (通常は 50 日) が長期移動平均 (200 日など) を上回るときに発生します。この強気のシグナルは、上昇の勢いと潜在的な価格上昇の強力な兆候として解釈されることがよくあります。
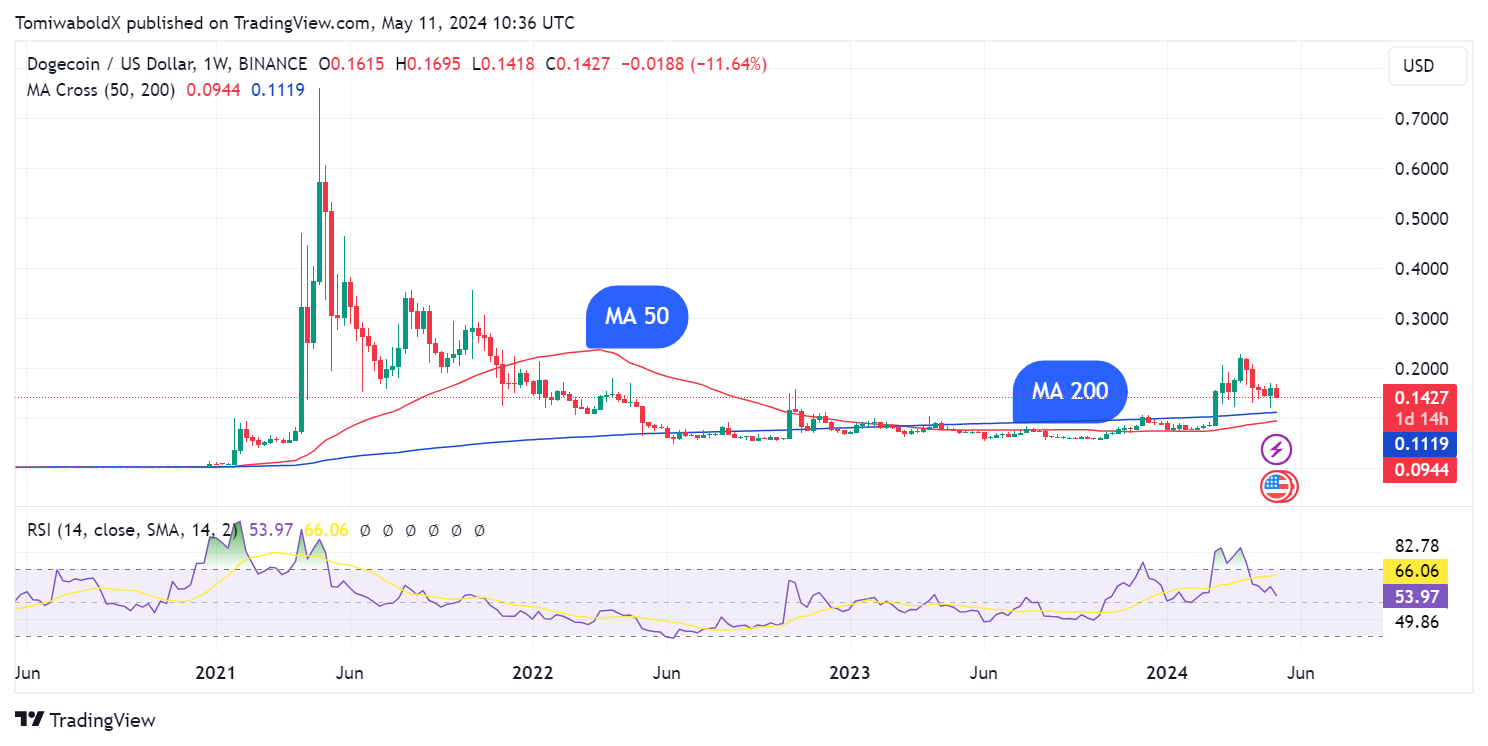
While golden crosses can occur on various time frames, a weekly golden cross holds particular significance as it reflects longer-term trends and investor sentiment.  DOGE/USD Weekly Chart, Courtesy: TradingView
In the case of Dogecoin, the 50-week SMA is rising northward and appears likely to move above the 200-week SMA, potentially resulting in a golden cross formation in the coming weeks. While expectations are in place for a golden cross, traders may need to observe the nature of the crossing to confirm it.
ゴールデン クロスはさまざまな時間枠で発生しますが、週次のゴールデン クロスは長期的な傾向と投資家心理を反映するため、特に重要です。 DOGE/USD 週次チャート、提供: TradingView ドージコインの場合、50 週間 SMA は北向きに上昇しており、200 週間 SMA を上回って推移する可能性があり、今後数週間でゴールデンクロス形成が起こる可能性があります。ゴールデンクロスの期待はありますが、トレーダーはそれを確認するためにクロスの性質を観察する必要があるかもしれません。
Dogecoin's journey toward this impending crossover has been marked by fluctuations. Following a steady decline since May 6 from highs of around $0.168, the dog-themed coin has shown resilience, finding support around the $0.142 level.
この差し迫ったクロスオーバーに向けたドージコインの旅は、変動によって特徴づけられました。 5月6日以来、約0.168ドルの高値から着実に下落してきたが、犬をテーマにしたコインは回復力を示し、0.142ドル付近でサポートを見つけている。
At the time of writing, Dogecoin was trading down 4.68% in the last 24 hours to $0.144 as the crypto market faced selling pressure.
執筆時点では、仮想通貨市場が売り圧力に直面しているため、ドージコインは過去24時間で4.68%下落し、0.144ドルとなった。
Implications of a Potential Golden Cross
ゴールデンクロスの可能性が示唆するもの
The last time Dogecoin witnessed a weekly golden cross was in early January 2021, resulting in an astonishing 7,996% price increase over the next four months. Dogecoin later rose to an all-time high of $0.737 on May 8, 2021.
ドージコインが最後に毎週のゴールデンクロスを目撃したのは2021年1月上旬で、その結果、その後4か月間で7,996%という驚くべき価格上昇をもたらしました。ドージコインはその後、2021年5月8日に史上最高値の0.737ドルまで上昇した。
While past performance is no guarantee of future results, the prospect of another golden cross has certainly captured the attention of the DOGE community.
過去の実績は将来の結果を保証するものではありませんが、新たなゴールデンクロスの可能性が DOGE コミュニティの注目を集めたことは確かです。
For traders, the golden cross is a signal to watch closely, as it could indicate the beginning of a new uptrend. However, it is crucial to approach such indicators with caution, as they can sometimes lead to false signals, potentially trapping traders on the wrong side of the market.
トレーダーにとって、ゴールデンクロスは新たな上昇トレンドの始まりを示す可能性があるため、注意深く監視する必要があるシグナルです。ただし、このような指標は時々誤ったシグナルにつながり、トレーダーを市場の間違った側に陥らせる可能性があるため、注意してこのような指標に取り組むことが重要です。


 Cryptopolitan
 DogeHome
 crypto.ro English
 Crypto News Land
 ETHNews
 CFN
CFN U_Today
 Thecoinrepublic.com


