Cover image via U.Today
U.Today를 통한 표지 이미지
As the cryptocurrency market navigates ongoing uncertainties, traders and analysts are closely monitoring a potentially significant technical formation for Dogecoin price: a moving average crossover on its weekly chart.
암호화폐 시장이 지속적인 불확실성을 헤쳐나가면서 거래자와 분석가들은 Dogecoin 가격에 대한 잠재적으로 중요한 기술적 형성, 즉 주간 차트의 이동 평균 교차를 면밀히 모니터링하고 있습니다.
The nature of the crossing will determine whether it is a bearish "death cross" or a bullish "golden cross."
교차의 성격에 따라 하락세의 "데드 크로스"인지 상승세의 "골든 크로스"인지가 결정됩니다.
A golden cross occurs when a shorter-term moving average (typically the 50-day) crosses above a longer-term moving average (such as the 200-day). This bullish signal is often interpreted as a strong indication of upward momentum and potential price increases.
골든 크로스는 단기 이동 평균(일반적으로 50일)이 장기 이동 평균(예: 200일)을 넘어설 때 발생합니다. 이러한 강세 신호는 종종 상승 모멘텀과 잠재적인 가격 상승을 나타내는 강력한 신호로 해석됩니다.
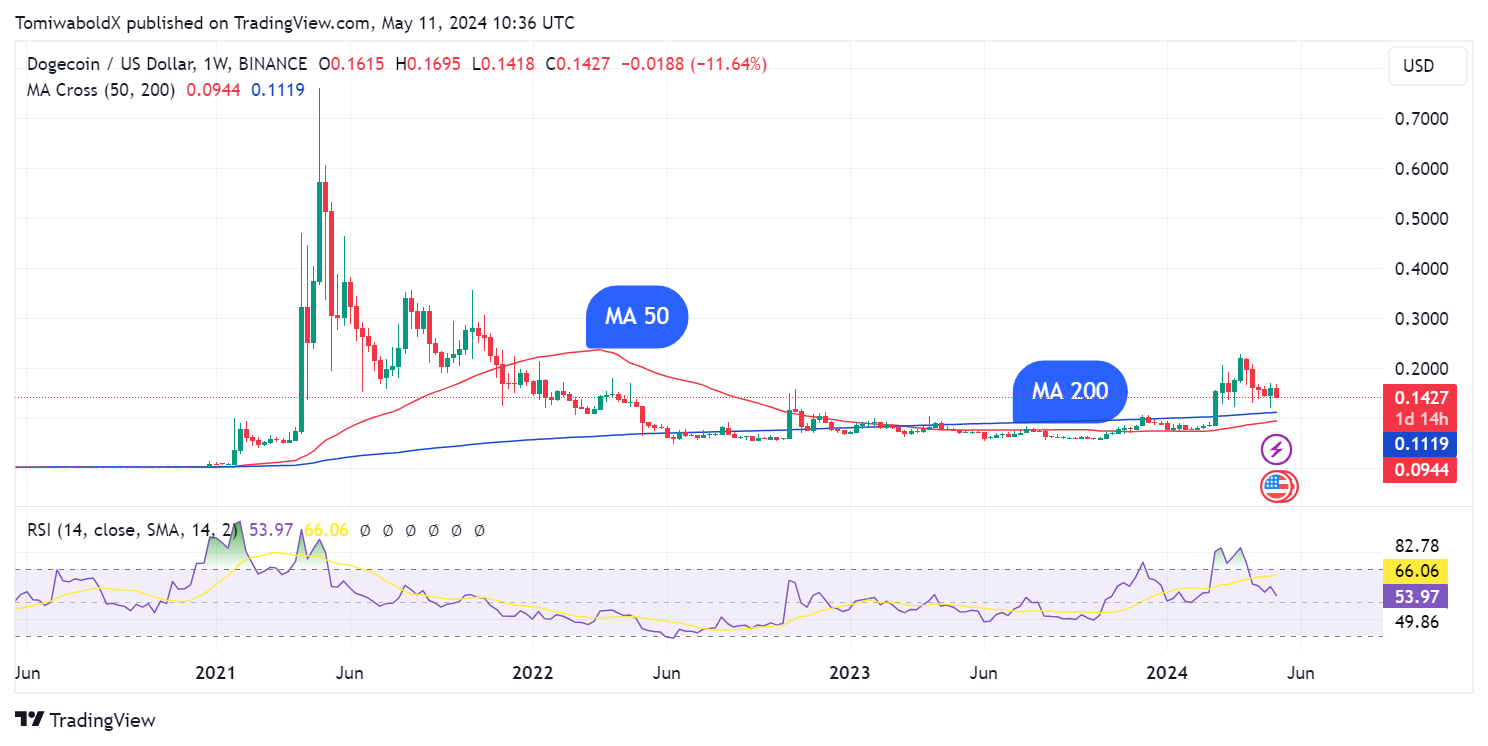
While golden crosses can occur on various time frames, a weekly golden cross holds particular significance as it reflects longer-term trends and investor sentiment.  DOGE/USD Weekly Chart, Courtesy: TradingView
In the case of Dogecoin, the 50-week SMA is rising northward and appears likely to move above the 200-week SMA, potentially resulting in a golden cross formation in the coming weeks. While expectations are in place for a golden cross, traders may need to observe the nature of the crossing to confirm it.
골든 크로스는 다양한 시간대에 발생할 수 있지만, 주간 골든 크로스는 장기적인 추세와 투자 심리를 반영한다는 점에서 특히 중요합니다. DOGE/USD 주간 차트, 제공: TradingView Dogecoin의 경우 50주 SMA가 북쪽으로 상승하고 있으며 200주 SMA를 넘어설 것으로 보이며 잠재적으로 향후 몇 주 안에 골든 크로스가 형성될 가능성이 있습니다. 골든 크로스에 대한 기대가 존재하는 동안 거래자는 이를 확인하기 위해 교차의 성격을 관찰해야 할 수도 있습니다.
Dogecoin's journey toward this impending crossover has been marked by fluctuations. Following a steady decline since May 6 from highs of around $0.168, the dog-themed coin has shown resilience, finding support around the $0.142 level.
이 임박한 크로스오버를 향한 Dogecoin의 여정은 변동으로 표시되었습니다. 5월 6일 이후 약 $0.168의 고점에서 꾸준히 하락한 후 개 테마 코인은 회복력을 보여 약 $0.142 수준에서 지지를 받았습니다.
At the time of writing, Dogecoin was trading down 4.68% in the last 24 hours to $0.144 as the crypto market faced selling pressure.
이 글을 쓰는 시점에 Dogecoin은 암호화폐 시장이 매도 압력에 직면하면서 지난 24시간 동안 4.68% 하락한 0.144달러에 거래되었습니다.
Implications of a Potential Golden Cross
잠재적인 골든 크로스의 의미
The last time Dogecoin witnessed a weekly golden cross was in early January 2021, resulting in an astonishing 7,996% price increase over the next four months. Dogecoin later rose to an all-time high of $0.737 on May 8, 2021.
Dogecoin이 주간 골든 크로스를 마지막으로 목격한 것은 2021년 1월 초였으며, 그 결과 향후 4개월 동안 가격이 7,996%라는 놀라운 상승을 보였습니다. Dogecoin은 이후 2021년 5월 8일에 사상 최고치인 $0.737로 상승했습니다.
While past performance is no guarantee of future results, the prospect of another golden cross has certainly captured the attention of the DOGE community.
과거 성과가 미래 결과를 보장하지는 않지만, 또 다른 골든 크로스의 전망은 확실히 DOGE 커뮤니티의 관심을 끌었습니다.
For traders, the golden cross is a signal to watch closely, as it could indicate the beginning of a new uptrend. However, it is crucial to approach such indicators with caution, as they can sometimes lead to false signals, potentially trapping traders on the wrong side of the market.
트레이더들에게 골든 크로스는 새로운 상승 추세의 시작을 나타낼 수 있으므로 면밀히 관찰해야 할 신호입니다. 그러나 이러한 지표는 때로는 잘못된 신호로 이어져 잠재적으로 거래자를 시장의 잘못된 쪽에 가두게 할 수 있으므로 주의해서 접근하는 것이 중요합니다.


 Cryptopolitan
 DogeHome
 crypto.ro English
 Crypto News Land
 ETHNews
 CFN
CFN U_Today
 Thecoinrepublic.com


