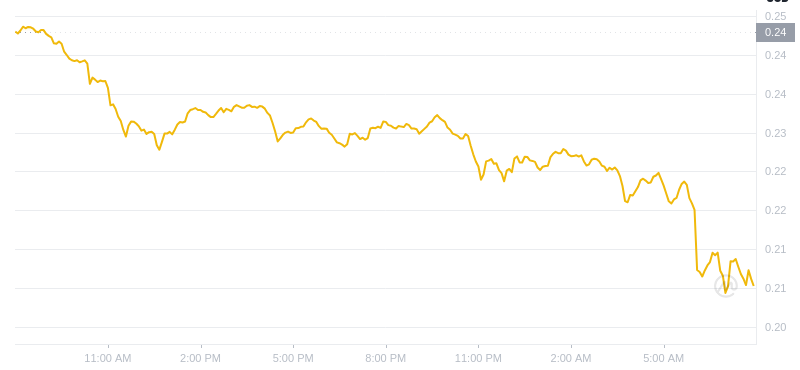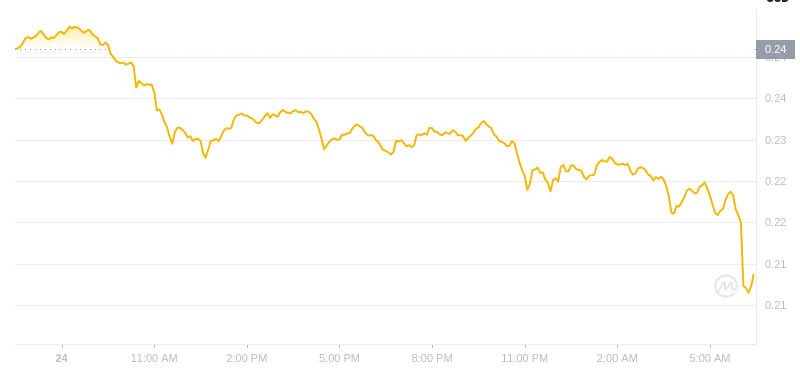
Dogecoin Struggles at $0.1285 Resistance Zone
Dogecoin (DOGE) has been unable to break above the $0.1285 resistance level against the US Dollar. It has consolidated and may attempt a push towards $0.1285 or even $0.1320.
Technical Analysis
DOGE is struggling to overcome the $0.1285 resistance zone. It is currently trading near $0.1240 and the 100-hourly simple moving average.
An hourly chart shows a short-term bullish flag pattern forming with resistance at $0.1250. A break above this level and $0.1285 is crucial for bullish momentum.
Resistance and Support Levels
- Resistance levels: $0.1250, $0.1285, $0.1320
- Support levels: $0.1230, $0.1220, $0.1185
Potential Upside and Downside
If DOGE can break through $0.1285, it could move towards $0.1320 and potentially $0.1350.
However, if it fails to gain traction above $0.1250, it could decline to $0.1230 and $0.1220. A break below $0.1220 could lead to further losses towards $0.1185.
Technical Indicators
- Hourly MACD: Losing momentum in the bearish zone
- Hourly RSI: Below the 50 level


 TheNewsCrypto
 Times Tabloid
 DogeHome
 CFN
CFN Crypto Daily™
 DogeHome
 Crypto Daily™
 TheCoinrise Media
 Crypto Daily™


