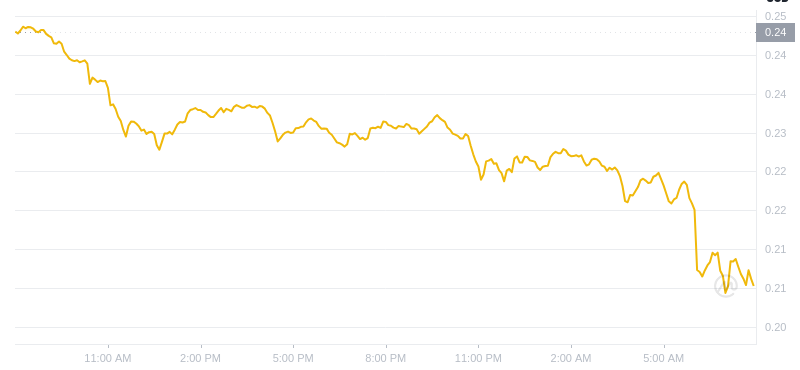
Dogecoin Struggles at $0.1285 Resistance Zone
Dogecoin은 $0.1285 저항 영역에서 투쟁합니다.
Dogecoin (DOGE) has been unable to break above the $0.1285 resistance level against the US Dollar. It has consolidated and may attempt a push towards $0.1285 or even $0.1320.
Dogecoin(DOGE)은 미국 달러 대비 $0.1285 저항선을 넘지 못했습니다. 통합되어 $0.1285 또는 $0.1320까지 상승을 시도할 수 있습니다.
Technical Analysis
기술적 분석
DOGE is struggling to overcome the $0.1285 resistance zone. It is currently trading near $0.1240 and the 100-hourly simple moving average.
DOGE는 $0.1285 저항 영역을 극복하기 위해 고군분투하고 있습니다. 현재 0.1240달러와 100시간 단순이동평균 근처에서 거래되고 있습니다.
An hourly chart shows a short-term bullish flag pattern forming with resistance at $0.1250. A break above this level and $0.1285 is crucial for bullish momentum.
시간별 차트는 $0.1250의 저항과 함께 형성되는 단기 강세 플래그 패턴을 보여줍니다. 이 수준과 0.1285달러를 넘는 돌파는 강세 모멘텀에 매우 중요합니다.
Resistance and Support Levels
저항 및 지원 수준
- Resistance levels: $0.1250, $0.1285, $0.1320
- Support levels: $0.1230, $0.1220, $0.1185
Potential Upside and Downside
저항 수준: $0.1250, $0.1285, $0.1320지원 수준: $0.1230, $0.1220, $0.1185잠재적 상승 및 하락
If DOGE can break through $0.1285, it could move towards $0.1320 and potentially $0.1350.
DOGE가 $0.1285를 돌파할 수 있다면 $0.1320, 잠재적으로 $0.1350 방향으로 이동할 수 있습니다.
However, if it fails to gain traction above $0.1250, it could decline to $0.1230 and $0.1220. A break below $0.1220 could lead to further losses towards $0.1185.
그러나 $0.1250 이상의 견인력을 얻지 못하면 $0.1230 및 $0.1220으로 하락할 수 있습니다. $0.1220 미만으로 하락하면 $0.1185까지 추가 손실이 발생할 수 있습니다.
Technical Indicators
기술 지표
- Hourly MACD: Losing momentum in the bearish zone
- Hourly RSI: Below the 50 level
시간별 MACD: 약세 영역에서 모멘텀을 잃음시간별 RSI: 50 수준 미만


 Optimisus
 U_Today
 TheCoinrise Media
 Optimisus
 DogeHome
 TheNewsCrypto
 Times Tabloid
 DogeHome
 CFN
CFN


