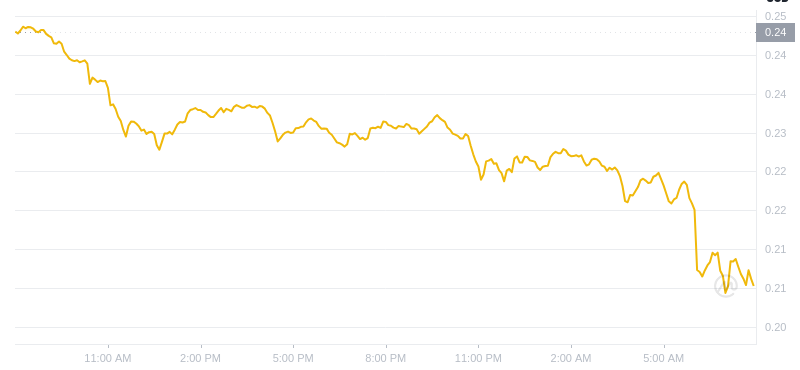
Dogecoin Struggles at $0.1285 Resistance Zone
ドージコイン、0.1285ドルのレジスタンスゾーンで苦戦
Dogecoin (DOGE) has been unable to break above the $0.1285 resistance level against the US Dollar. It has consolidated and may attempt a push towards $0.1285 or even $0.1320.
ドージコイン(DOGE)は対米ドルで0.1285ドルの抵抗水準を突破できていない。値固めされており、0.1285ドル、さらには0.1320ドルに向けて上昇を試みる可能性がある。
Technical Analysis
テクニカル分析
DOGE is struggling to overcome the $0.1285 resistance zone. It is currently trading near $0.1240 and the 100-hourly simple moving average.
DOGEは0.1285ドルのレジスタンスゾーンを克服するのに苦労している。現在は0.1240ドルと100時間単純移動平均付近で取引されている。
An hourly chart shows a short-term bullish flag pattern forming with resistance at $0.1250. A break above this level and $0.1285 is crucial for bullish momentum.
時間足チャートは、0.1250ドルに抵抗線が形成されている短期強気フラグパターンを示しています。この水準と0.1285ドルを突破することが強気の勢いにとって極めて重要だ。
Resistance and Support Levels
レジスタンスレベルとサポートレベル
- Resistance levels: $0.1250, $0.1285, $0.1320
- Support levels: $0.1230, $0.1220, $0.1185
Potential Upside and Downside
レジスタンスレベル: $0.1250、$0.1285、$0.1320サポートレベル: $0.1230、$0.1220、$0.1185潜在的な上値と下値
If DOGE can break through $0.1285, it could move towards $0.1320 and potentially $0.1350.
DOGEが0.1285ドルを突破できれば、0.1320ドル、さらには0.1350ドルに向かう可能性がある。
However, if it fails to gain traction above $0.1250, it could decline to $0.1230 and $0.1220. A break below $0.1220 could lead to further losses towards $0.1185.
ただし、0.1250ドルを超えて牽引力を得ることができなかった場合、0.1230ドルと0.1220ドルまで下落する可能性がある。 0.1220ドルを下回ると、0.1185ドルに向けてさらなる損失が発生する可能性があります。
Technical Indicators
テクニカル指標
- Hourly MACD: Losing momentum in the bearish zone
- Hourly RSI: Below the 50 level
時間別MACD: 弱気ゾーンで勢いを失う時間別RSI: 50レベルを下回る


 Optimisus
 U_Today
 TheCoinrise Media
 Optimisus
 DogeHome
 TheNewsCrypto
 Times Tabloid
 DogeHome
 CFN
CFN


