

Dogecoin's price chart consistently displays descending wedge patterns, followed by decisive breakouts, suggesting strong upward momentum driven by recurring technical formations.
A key support zone between $0.05 and $0.07 repeatedly attracts buyers, acting as a crucial foundation for price recovery during periods of consolidation.
Technical indicators like the RSI and MACD provide further insights, showing early bullish crossovers that reinforce the chart's recurring breakout cycles.
Dogecoin has recently garnered significant market attention due to these repeated descending wedge formations and subsequent explosive breakouts. This technical analysis has fueled expectations of a potential price surge, prompting experts to closely monitor key support and resistance levels.
Technical Chart Patterns
A tweet from crypto influencer JAVONMARKS stated, "Yep, $DOGE (Dogecoin) still looks well on track for a significant surge to new all-time highs above the $0.73905 levels. Currently, that’d consist of an over 261% climb!" The tweet included a chart illustrating large downward consolidations forming wedges and triangles, each preceding a sharp breakout to higher prices.
Price action reveals recurring cycles of lower highs and converging lows. A clear falling wedge pattern has emerged since late 2022. Volume typically decreases during consolidation phases and increases dramatically during breakouts. Technical analysts track these phases to assess potential upward movement.
Support and Resistance Zones
A significant support area between $0.05 and $0.07 has repeatedly attracted buyer interest during price pullbacks, serving as a buffer against downward pressure.
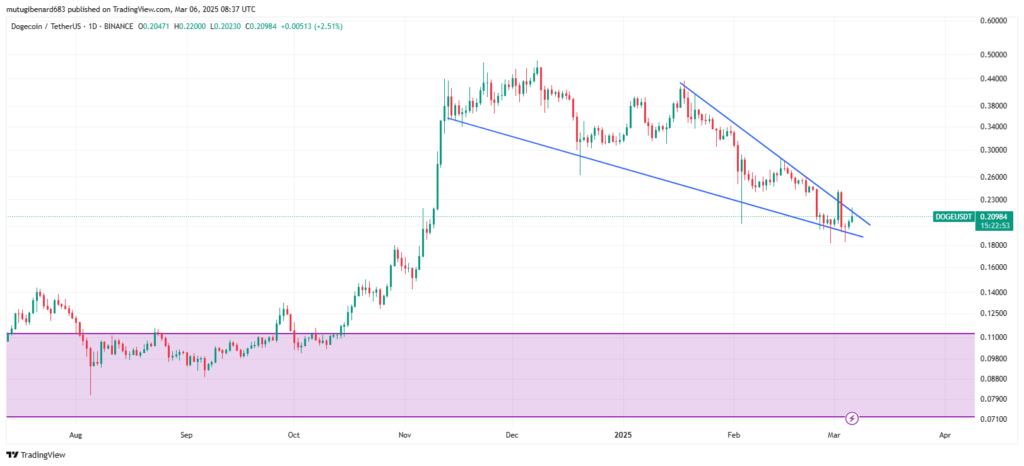
Source: TradingView
Upper resistance levels are defined by recent swing highs in December and February. A decisive daily close above the descending trendline could trigger a breakout. Failure to sustain this breakout might lead to a retest of the support levels. Traders utilize these key levels to formulate their entry and exit strategies.
Market Sentiment and Technical Indicators
Technical indicators offer additional context to Dogecoin's price dynamics. The Relative Strength Index (RSI) currently sits near the mid-40s. The Moving Average Convergence Divergence (MACD) shows early signs of a bullish crossover. These signals align with the recurring breakout cycles observed on the chart.
At the time of writing, Dogecoin traded at $0.214, with a 24-hour volume exceeding $1.5 billion. The token experienced a 7.43% increase in one day and a 3.21% rise over the past week. Market experts closely monitor these formations within the broader cryptocurrency market trends. Seasoned professionals in the crypto space are also actively tracking this technical setup.
 Cryptopolitan_News
 DogeHome
 Captain Altcoin
") Leading Crypto News, Analysis & Research | BSCN (fka BSC News)
Leading Crypto News, Analysis & Research | BSCN (fka BSC News) Captain Altcoin
 Optimisus
 CryptoNewsLand
 CoinPedia News


