

Dogecoin's price chart consistently displays descending wedge patterns, followed by decisive breakouts, suggesting strong upward momentum driven by recurring technical formations.
Dogecoinの価格チャートは、降順のウェッジパターンを一貫して表示し、その後、決定的なブレイクアウトが続き、技術形成の繰り返しによって駆動される強力な上昇の勢いを示唆しています。
A key support zone between $0.05 and $0.07 repeatedly attracts buyers, acting as a crucial foundation for price recovery during periods of consolidation.
0.05ドルから0.07ドルの主要なサポートゾーンは、繰り返し購入者を引き付け、統合期間中の価格回復の重要な基盤として機能します。
Technical indicators like the RSI and MACD provide further insights, showing early bullish crossovers that reinforce the chart's recurring breakout cycles.
RSIやMACDなどの技術的指標は、さらに洞察を提供し、チャートの繰り返しブレイクアウトサイクルを強化する初期の強気なクロスオーバーを示しています。
Dogecoin has recently garnered significant market attention due to these repeated descending wedge formations and subsequent explosive breakouts. This technical analysis has fueled expectations of a potential price surge, prompting experts to closely monitor key support and resistance levels.
Dogecoinは最近、これらの繰り返し下降くウェッジ層とその後の爆発的なブレイクアウトのために、市場の注目を集めています。 このテクニカル分析により、潜在的な価格の急増に対する期待が高まり、専門家が主要なサポートと抵抗レベルを綿密に監視するよう促しました。
Technical Chart Patterns
技術チャートパターン
A tweet from crypto influencer JAVONMARKS stated, "Yep, $DOGE (Dogecoin) still looks well on track for a significant surge to new all-time highs above the $0.73905 levels. Currently, that’d consist of an over 261% climb!" The tweet included a chart illustrating large downward consolidations forming wedges and triangles, each preceding a sharp breakout to higher prices.
暗号インフルエンサーのJavonmarksからのツイートは、「うん、$ Doge(Dogecoin)は、0.73905ドルのレベルを超える史上最高の高値への大幅な急増を順調に見ています。現在、それは261%を超える上昇で構成されています!」 このツイートには、ウェッジと三角形を形成する大きな下向きの統合を示すチャートが含まれていました。
Price action reveals recurring cycles of lower highs and converging lows. A clear falling wedge pattern has emerged since late 2022. Volume typically decreases during consolidation phases and increases dramatically during breakouts. Technical analysts track these phases to assess potential upward movement.
価格アクションにより、高値の下部の繰り返しサイクルと収束する低いサイクルが明らかになります。 2022年後半から明確な落下ウェッジパターンが現れています。通常、統合段階でボリュームは減少し、ブレイクアウト中に劇的に増加します。テクニカルアナリストはこれらのフェーズを追跡して、潜在的な上向きの動きを評価します。
Support and Resistance Zones
サポートゾーンと抵抗ゾーン
A significant support area between $0.05 and $0.07 has repeatedly attracted buyer interest during price pullbacks, serving as a buffer against downward pressure.
0.05ドルから0.07ドルの間の重要なサポートエリアは、価格プルバック中にバイヤーの利息を繰り返し引き付け、下向きの圧力に対するバッファーとして機能します。
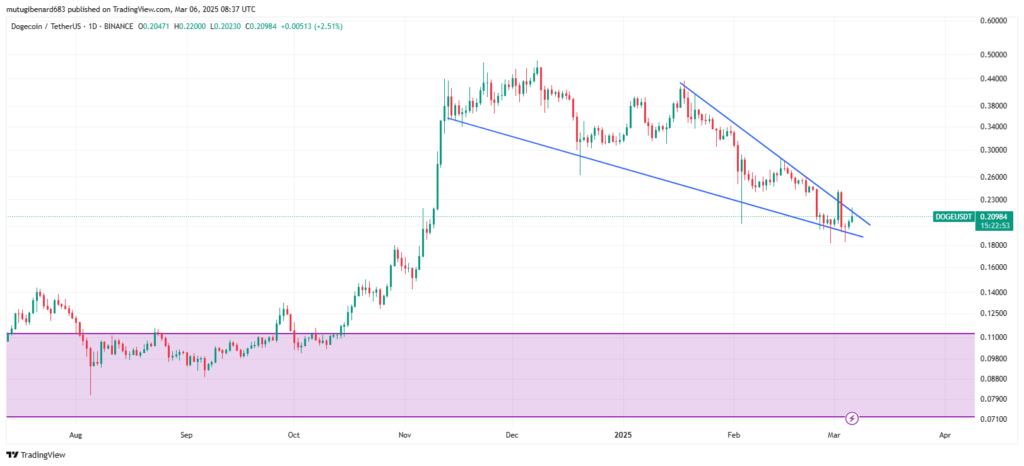
Source: TradingView
出典:TradingView
Upper resistance levels are defined by recent swing highs in December and February. A decisive daily close above the descending trendline could trigger a breakout. Failure to sustain this breakout might lead to a retest of the support levels. Traders utilize these key levels to formulate their entry and exit strategies.
上部抵抗レベルは、12月と2月の最近のスイング高値によって定義されます。降順のトレンドラインを上回る決定的な毎日の閉鎖は、ブレイクアウトを引き起こす可能性があります。 このブレイクアウトを維持できないと、サポートレベルの再テストにつながる可能性があります。トレーダーは、これらの重要なレベルを利用して、エントリ戦略と出口戦略を策定します。
Market Sentiment and Technical Indicators
市場の感情と技術指標
Technical indicators offer additional context to Dogecoin's price dynamics. The Relative Strength Index (RSI) currently sits near the mid-40s. The Moving Average Convergence Divergence (MACD) shows early signs of a bullish crossover. These signals align with the recurring breakout cycles observed on the chart.
テクニカルインジケーターは、Dogecoinの価格ダイナミクスに追加のコンテキストを提供します。現在、相対強度指数(RSI)は40年代半ば近くにあります。移動平均収束発散(MACD)は、強気のクロスオーバーの初期の兆候を示しています。これらの信号は、チャートで観察された繰り返しのブレークアウトサイクルと一致します。
At the time of writing, Dogecoin traded at $0.214, with a 24-hour volume exceeding $1.5 billion. The token experienced a 7.43% increase in one day and a 3.21% rise over the past week. Market experts closely monitor these formations within the broader cryptocurrency market trends. Seasoned professionals in the crypto space are also actively tracking this technical setup.
執筆時点で、Dogecoinは0.214ドルで取引され、24時間のボリュームは15億ドルを超えています。トークンは、1日で7.43%増加し、過去1週間で3.21%増加しました。市場の専門家は、より広範な暗号通貨市場の動向内でこれらのフォーメーションを綿密に監視しています。 暗号スペースのベテランの専門家も、この技術的なセットアップを積極的に追跡しています。
 Cryptopolitan_News
 DogeHome
 Captain Altcoin
") Leading Crypto News, Analysis & Research | BSCN (fka BSC News)
Leading Crypto News, Analysis & Research | BSCN (fka BSC News) Captain Altcoin
 Optimisus
 CryptoNewsLand
 CoinPedia News


