

Dogecoin's price chart consistently displays descending wedge patterns, followed by decisive breakouts, suggesting strong upward momentum driven by recurring technical formations.
Dogecoin的价格图始终显示出下降的楔形模式,然后是果断的突破,表明反复出现的技术形态驱动了强劲的势头。
A key support zone between $0.05 and $0.07 repeatedly attracts buyers, acting as a crucial foundation for price recovery during periods of consolidation.
在$ 0.05到$ 0.07之间的关键支持区反复吸引买家,这是合并期间价格恢复至关重要的基础。
Technical indicators like the RSI and MACD provide further insights, showing early bullish crossovers that reinforce the chart's recurring breakout cycles.
RSI和MACD等技术指标提供了进一步的见解,显示了早期看涨的跨界,从而增强了图表的反复突破周期。
Dogecoin has recently garnered significant market attention due to these repeated descending wedge formations and subsequent explosive breakouts. This technical analysis has fueled expectations of a potential price surge, prompting experts to closely monitor key support and resistance levels.
由于这些反复的下降楔形形成和随后的爆炸性突破,Dogecoin最近引起了市场的大大关注。 这种技术分析促进了对潜在价格涨幅的期望,促使专家密切监视关键支持和阻力水平。
Technical Chart Patterns
技术图表模式
A tweet from crypto influencer JAVONMARKS stated, "Yep, $DOGE (Dogecoin) still looks well on track for a significant surge to new all-time highs above the $0.73905 levels. Currently, that’d consist of an over 261% climb!" The tweet included a chart illustrating large downward consolidations forming wedges and triangles, each preceding a sharp breakout to higher prices.
加密影响者Javonmarks的一条推文说:“是的,$ Doge(Dogecoin)仍然可以很好地走上高于0.73905美元水平的新历史高峰。目前,这包括超过261%的攀登!” 该推文包括一张图表,说明了形成楔形和三角形的大量下降整合,每个块在较高的价格之前突破了。
Price action reveals recurring cycles of lower highs and converging lows. A clear falling wedge pattern has emerged since late 2022. Volume typically decreases during consolidation phases and increases dramatically during breakouts. Technical analysts track these phases to assess potential upward movement.
价格动作揭示了较低高点和融合低点的经常性周期。自2022年底以来,出现了明显的楔形模式。在巩固阶段的体积通常会减少,并在突破期间急剧增加。技术分析师跟踪这些阶段以评估潜在的向上运动。
Support and Resistance Zones
支持和阻力区
A significant support area between $0.05 and $0.07 has repeatedly attracted buyer interest during price pullbacks, serving as a buffer against downward pressure.
在价格下跌期间,一个重大的支持区域在0.05美元至0.07美元之间,一再吸引了买方的利息,可作为防止压力的缓冲。
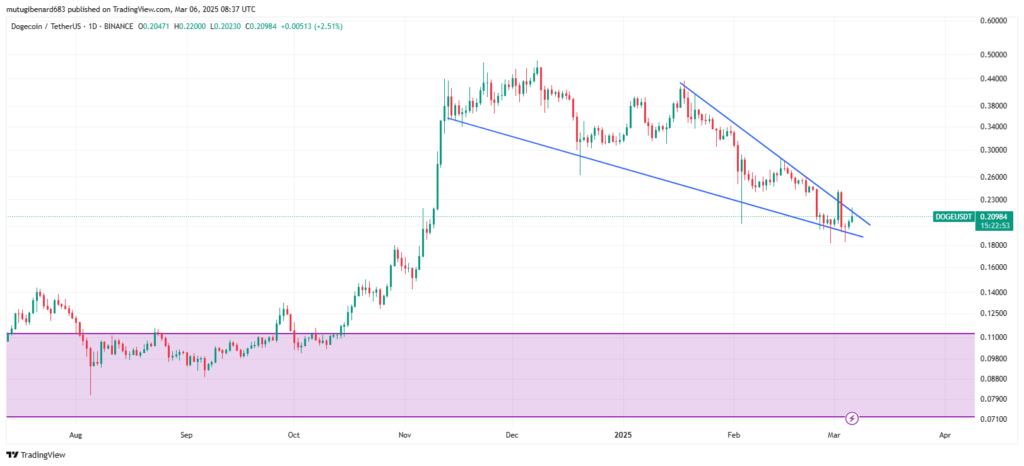
Source: TradingView
资料来源:TradingView
Upper resistance levels are defined by recent swing highs in December and February. A decisive daily close above the descending trendline could trigger a breakout. Failure to sustain this breakout might lead to a retest of the support levels. Traders utilize these key levels to formulate their entry and exit strategies.
高电阻水平由最近12月和2月的秋千高点定义。在下降趋势线以上的决定性每天都可能引发突破。 无法维持此突破可能会导致支持水平的重新测试。交易者利用这些关键水平来制定其进入和退出策略。
Market Sentiment and Technical Indicators
市场情绪和技术指标
Technical indicators offer additional context to Dogecoin's price dynamics. The Relative Strength Index (RSI) currently sits near the mid-40s. The Moving Average Convergence Divergence (MACD) shows early signs of a bullish crossover. These signals align with the recurring breakout cycles observed on the chart.
技术指标为Dogecoin的价格动态提供了其他背景。目前,相对强度指数(RSI)位于40年代中期。移动平均值收敛差异(MACD)显示了看涨跨界的早期迹象。这些信号与图表上观察到的重复突破周期保持一致。
At the time of writing, Dogecoin traded at $0.214, with a 24-hour volume exceeding $1.5 billion. The token experienced a 7.43% increase in one day and a 3.21% rise over the past week. Market experts closely monitor these formations within the broader cryptocurrency market trends. Seasoned professionals in the crypto space are also actively tracking this technical setup.
在撰写本文时,Dogecoin的交易价格为0.214美元,数量超过15亿美元。代币一天在过去一周中增长了7.43%,增长了3.21%。市场专家在更广泛的加密货币市场趋势中密切监视这些构造。 加密货币领域的经验丰富的专业人士也在积极跟踪这种技术设置。
 Cryptopolitan_News
 DogeHome
 Captain Altcoin
") Leading Crypto News, Analysis & Research | BSCN (fka BSC News)
Leading Crypto News, Analysis & Research | BSCN (fka BSC News) Captain Altcoin
 Optimisus
 CryptoNewsLand
 CoinPedia News


