

You can also read this news on COINTURK NEWS: Dogecoin Technical Analysis: A Closer Look at the Trend
With the rally that occurred in 2021, the memecoin sector, which entered our lives, continues to experience notable developments. Dogecoin almost showed no presence in the recent memecoin hype, which continues to be a topic in various blockchain ecosystems, including the Solana network. So, what is expected for Dogecoin in the upcoming period? Let’s examine together.
Dogecoin Chart Analysis
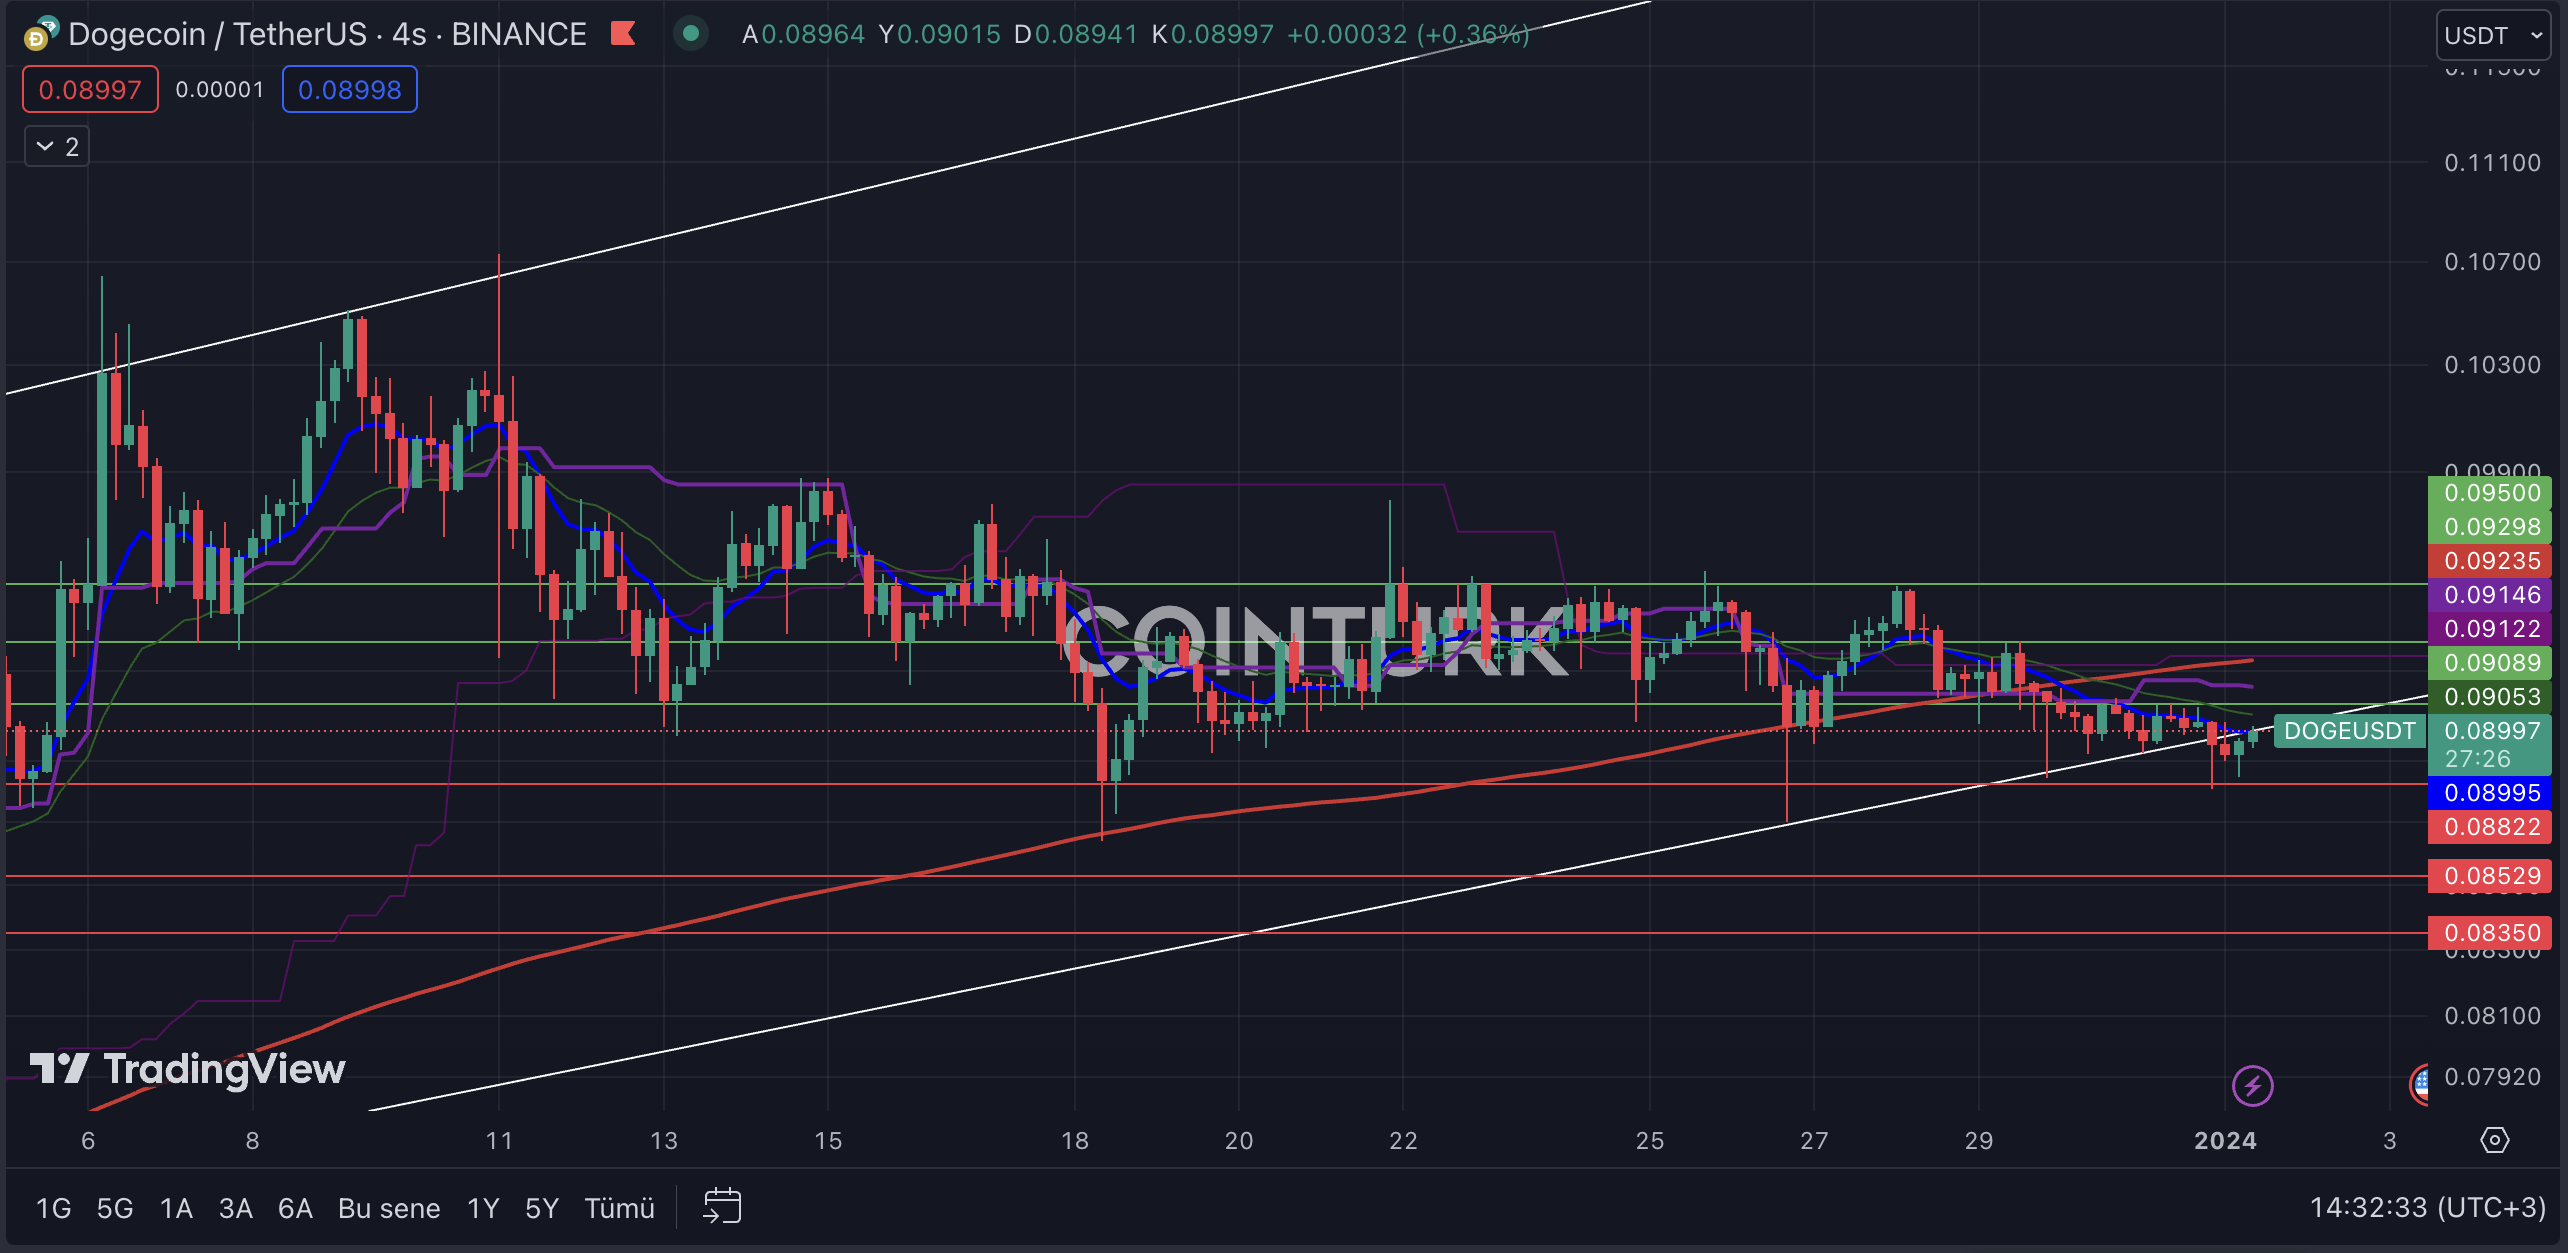
The first noticeable formation structure in the four-hour Dogecoin chart is the ascending channel formation. This structure indicates important clues for investors as there has been no support or resistance break until the last bar formation. However, with the last bars closing below the support line, the possibility of a negative scenario for DOGE in the coming period is increasing.
The most important support levels to watch on the four-hour Dogecoin chart are; $0.08822, $0.08529, and $0.08350, respectively. Especially if the closing of the last bars occurs below the crucial $0.08822 level, it will create selling pressure on the DOGE price.
On the other hand, the most important resistance levels to follow on the four-hour DOGE chart are; $0.09089, $0.09298, and $0.09500, respectively. A four-hour bar closing above the $0.09089 level, which intersects with EMA 21 (blue line), will allow DOGE to trade back within the formation zone and keep the recent break as a bear trap.
Dogecoin Weekly Chart Analysis
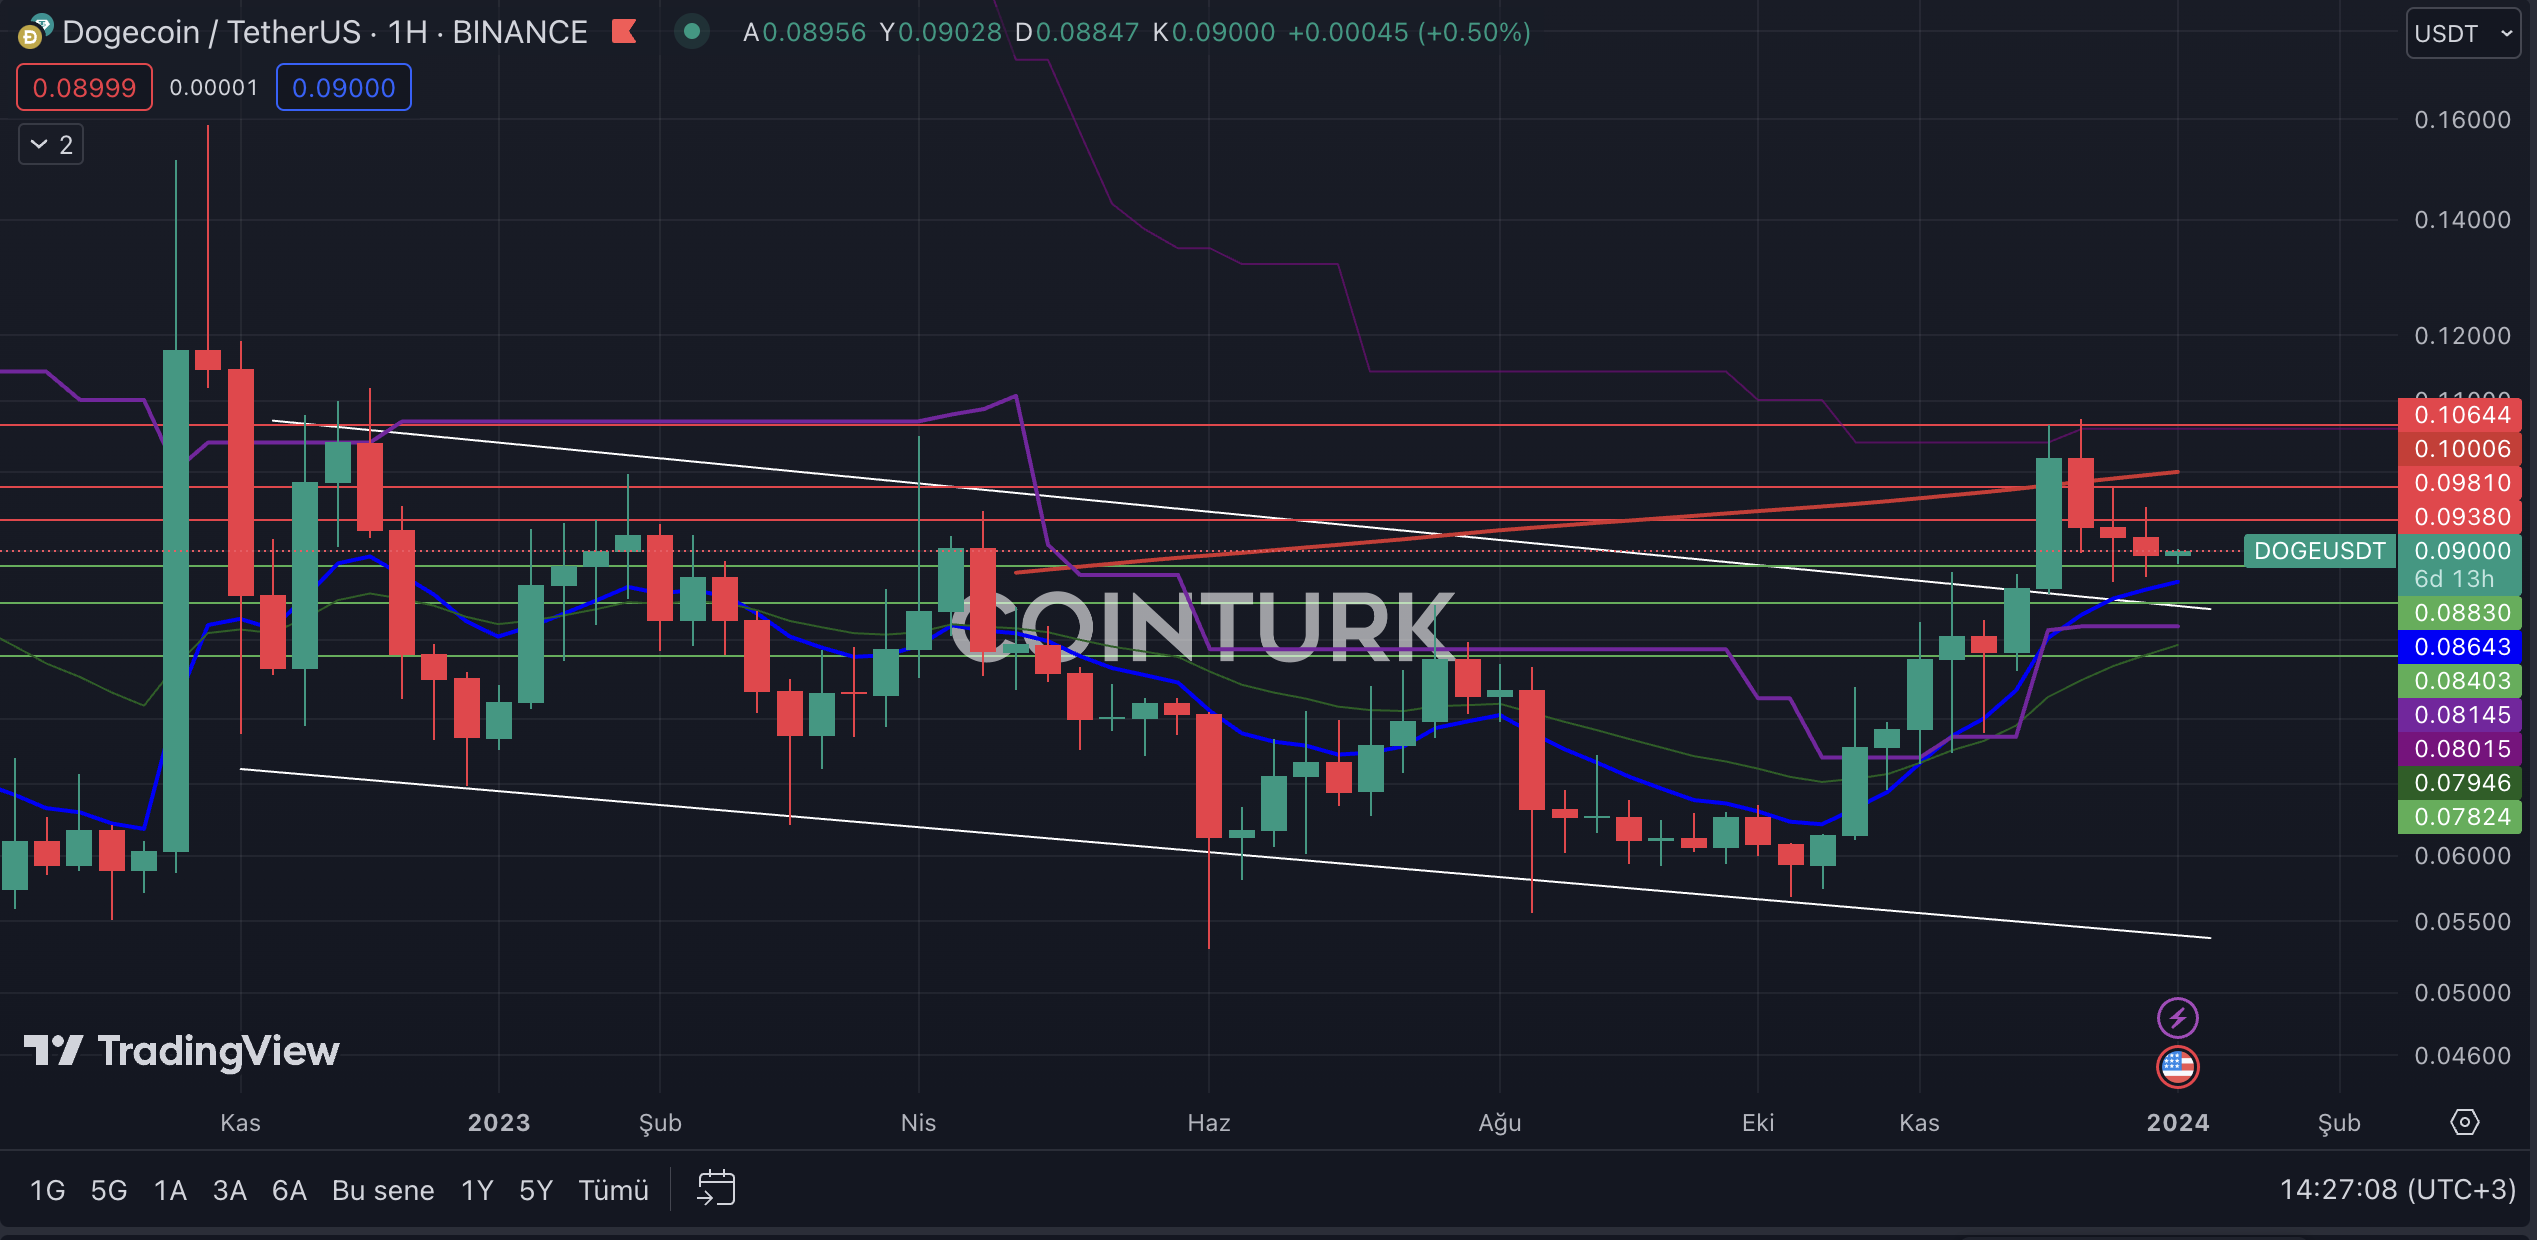
The first noticeable formation structure in the weekly Dogecoin chart is the descending channel formation, which led to an upward movement with the resistance break that occurred last month. However, the EMA 200 (red line) acting as resistance has led to selling pressure on DOGE, and the price continues to trade above the resistance line for now.
The most important support levels for Dogecoin to watch are; $0.08830, $0.08403, and $0.07824, respectively. Particularly, a weekly bar closing below the significant $0.08830 level in recent weeks will cause DOGE’s price to lose momentum.
The most important resistance levels to follow on the weekly chart for Dogecoin are; $0.09380, $0.09810, and $0.10644, respectively. Especially a weekly bar closing above the $0.09810 level, which intersects with EMA 200, will help DOGE’s price gain momentum.
 DeFi Planet
 Crypto Daily™
 BlockchainReporter
 TheCoinrise Media
 DogeHome
 Crypto Daily™
 Crypto Daily™
 TheCoinrise Media


