

You can also read this news on COINTURK NEWS: Dogecoin Technical Analysis: A Closer Look at the Trend
您也可以在 COINTURK NEWS 上閱讀此新聞:狗狗幣技術分析:仔細觀察趨勢
With the rally that occurred in 2021, the memecoin sector, which entered our lives, continues to experience notable developments. Dogecoin almost showed no presence in the recent memecoin hype, which continues to be a topic in various blockchain ecosystems, including the Solana network. So, what is expected for Dogecoin in the upcoming period? Let’s examine together.
隨著 2021 年的反彈,進入我們生活的 memecoin 行業繼續經歷顯著的發展。狗狗幣在最近的 memecoin 炒作中幾乎沒有出現,這仍然是包括 Solana 網路在內的各種區塊鏈生態系統中的一個話題。那麼,狗狗幣在未來一段時間的預期是什麼?我們一起來考察一下。
Dogecoin Chart Analysis
狗狗幣圖表分析
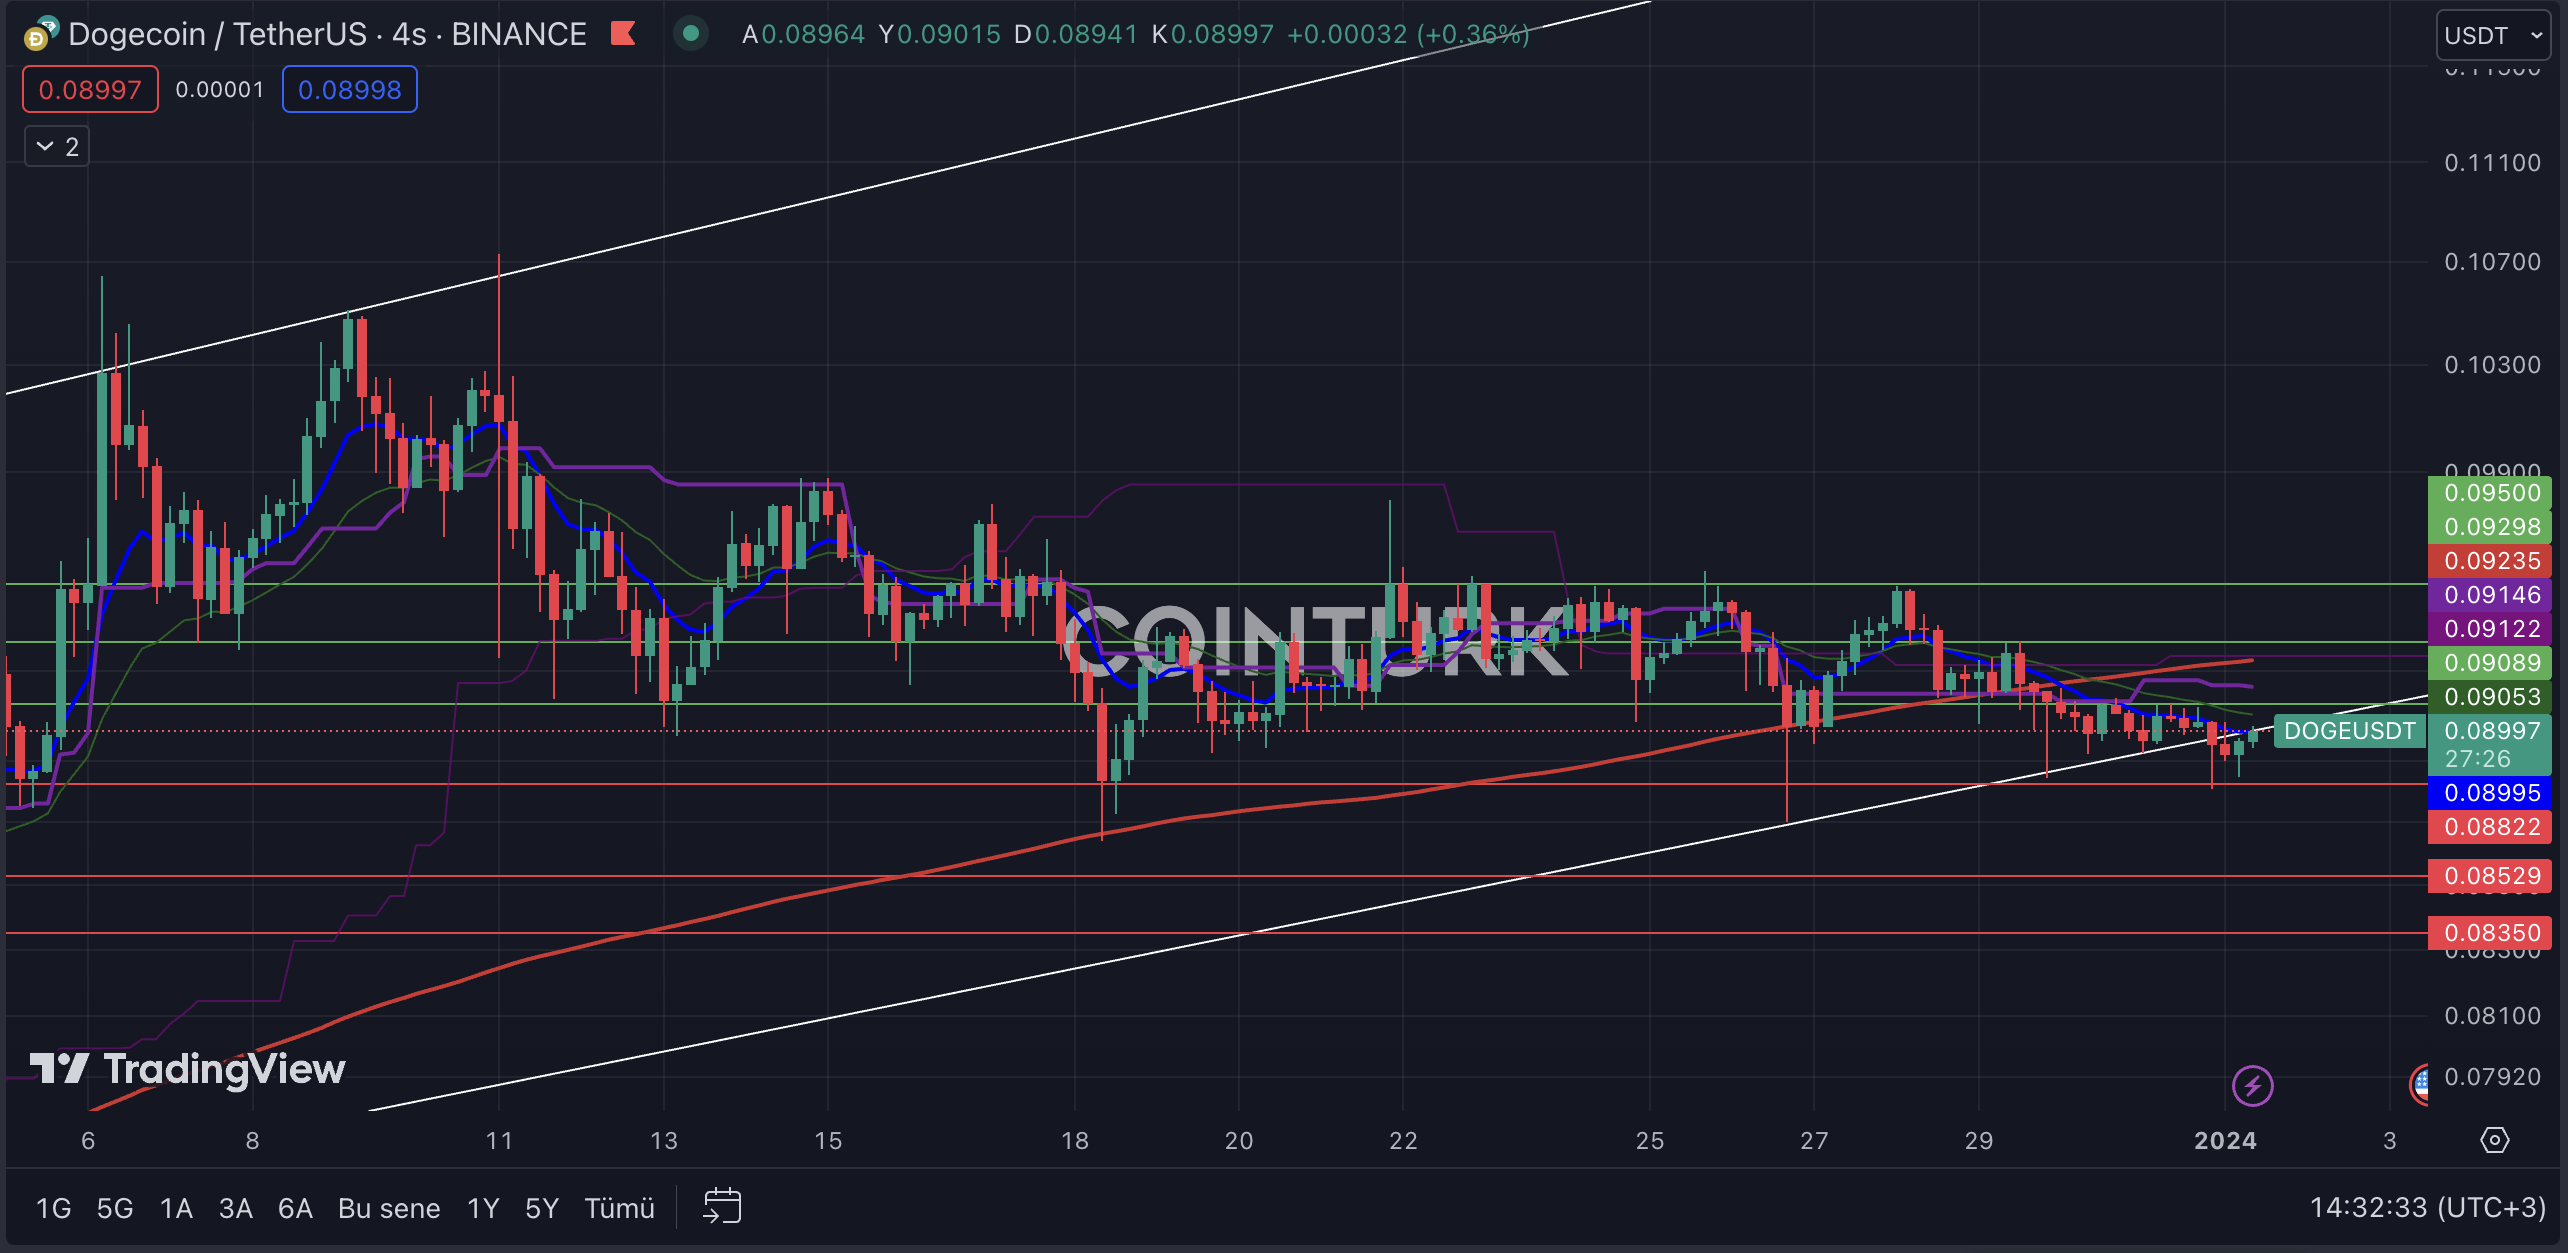
The first noticeable formation structure in the four-hour Dogecoin chart is the ascending channel formation. This structure indicates important clues for investors as there has been no support or resistance break until the last bar formation. However, with the last bars closing below the support line, the possibility of a negative scenario for DOGE in the coming period is increasing.
四小時狗狗幣圖表中第一個值得注意的形成結構是上升通道形成。這種結構為投資者提供了重要線索,因為直到最後一根柱形形成之前都沒有突破支撐或阻力。然而,隨著最後一根柱線收在支撐線下方,DOGE 在未來一段時間內出現負面情況的可能性正在增加。
The most important support levels to watch on the four-hour Dogecoin chart are; $0.08822, $0.08529, and $0.08350, respectively. Especially if the closing of the last bars occurs below the crucial $0.08822 level, it will create selling pressure on the DOGE price.
四小時狗狗幣圖表上值得關注的最重要的支撐位是:分別為 0.08822 美元、0.08529 美元和 0.08350 美元。特別是如果最後一根柱的收盤價低於關鍵的 0.08822 美元水平,則會對 DOGE 價格造成拋售壓力。
On the other hand, the most important resistance levels to follow on the four-hour DOGE chart are; $0.09089, $0.09298, and $0.09500, respectively. A four-hour bar closing above the $0.09089 level, which intersects with EMA 21 (blue line), will allow DOGE to trade back within the formation zone and keep the recent break as a bear trap.
另一方面,四小時 DOGE 圖表上最重要的阻力位在:分別為 0.09089 美元、0.09298 美元和 0.09500 美元。四小時柱線收於 0.09089 美元上方,與 EMA 21(藍線)相交,將使 DOGE 能夠在形成區域內進行交易,並將最近的突破視為空頭陷阱。
Dogecoin Weekly Chart Analysis
狗狗幣每週圖表分析
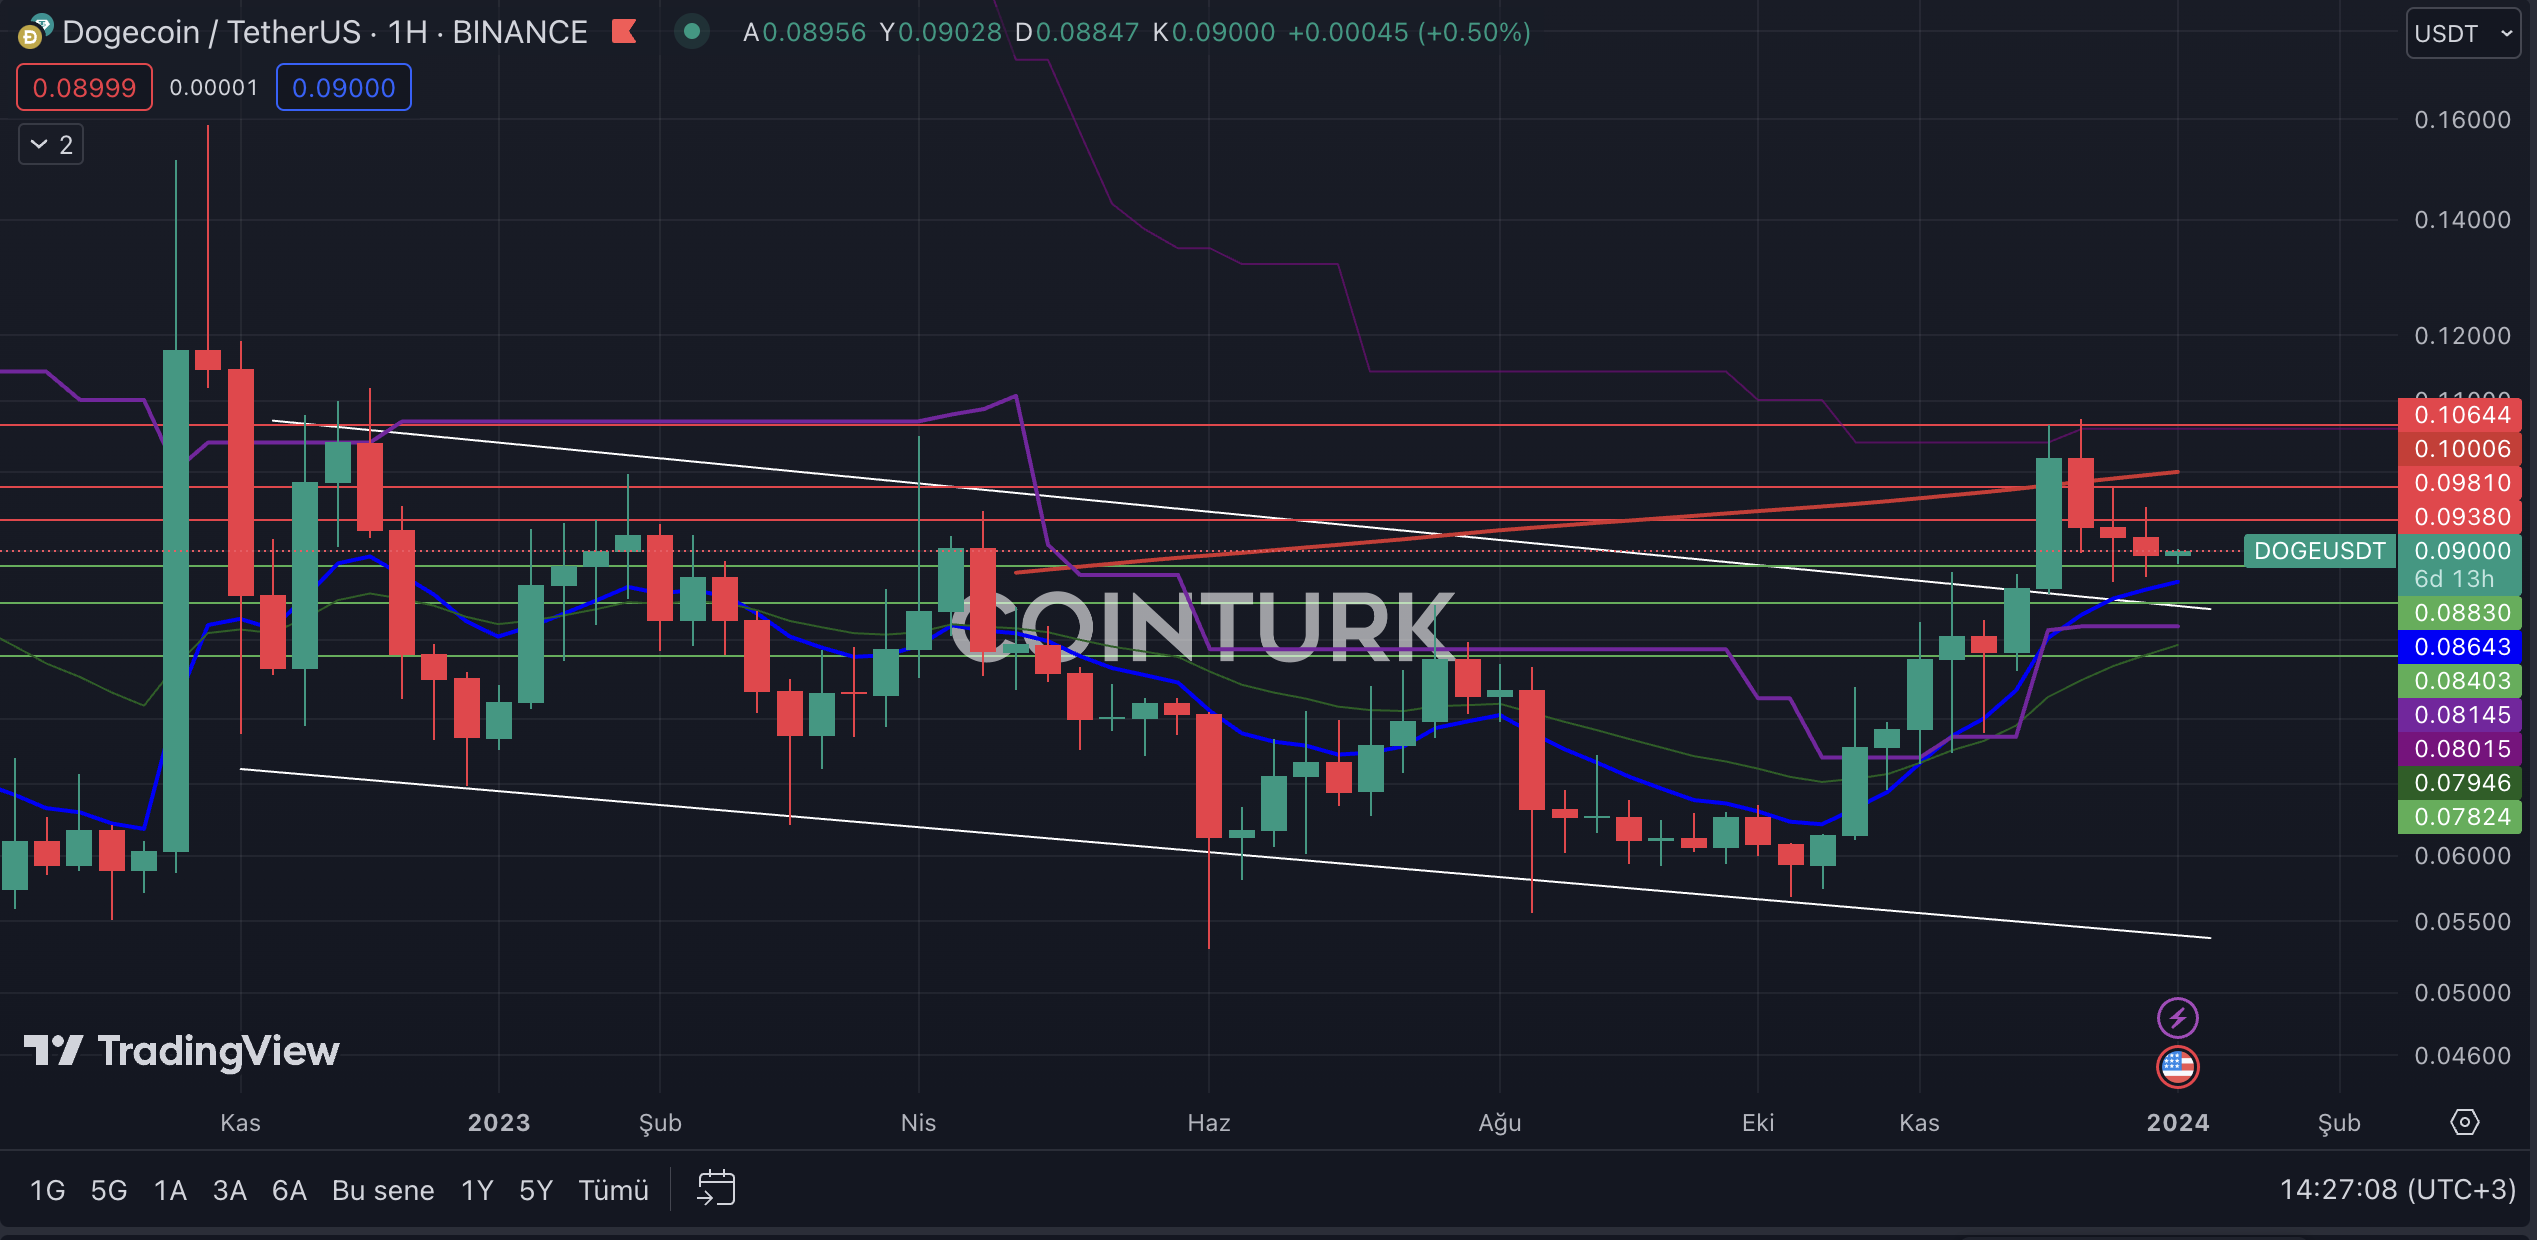
The first noticeable formation structure in the weekly Dogecoin chart is the descending channel formation, which led to an upward movement with the resistance break that occurred last month. However, the EMA 200 (red line) acting as resistance has led to selling pressure on DOGE, and the price continues to trade above the resistance line for now.
狗狗幣每週圖表中第一個值得注意的形成結構是下降通道形成,它導致上個月發生的阻力突破後向上移動。然而,200 EMA(紅線)作為阻力,導致 DOGE 面臨拋售壓力,目前價格繼續在阻力線上方交易。
The most important support levels for Dogecoin to watch are; $0.08830, $0.08403, and $0.07824, respectively. Particularly, a weekly bar closing below the significant $0.08830 level in recent weeks will cause DOGE’s price to lose momentum.
狗狗幣最值得關注的支撐位是:分別為 0.08830 美元、0.08403 美元和 0.07824 美元。特別是,最近幾週收盤價低於 0.08830 美元的周線將導致 DOGE 的價格失去動力。
The most important resistance levels to follow on the weekly chart for Dogecoin are; $0.09380, $0.09810, and $0.10644, respectively. Especially a weekly bar closing above the $0.09810 level, which intersects with EMA 200, will help DOGE’s price gain momentum.
狗狗幣週線圖上最重要的阻力位子是:分別為 0.09380 美元、0.09810 美元和 0.10644 美元。尤其是周線收盤價高於 0.09810 美元(與 EMA 200 相交),將有助於 DOGE 的價格獲得動力。
The post first appeared on COINTURK NEWS: Dogecoin Technical Analysis: A Closer Look at the Trend
該帖子首次出現在 COINTURK 新聞上:狗狗幣技術分析:仔細觀察趨勢
 Crypto News Land
 ETHNews
 CFN
CFN U_Today
 Thecoinrepublic.com
 DogeHome
 Optimisus
 Optimisus
 DeFi Planet


