

You can also read this news on COINTURK NEWS: Dogecoin Technical Analysis: A Closer Look at the Trend
您还可以在 COINTURK NEWS 上阅读此新闻:狗狗币技术分析:仔细观察趋势
With the rally that occurred in 2021, the memecoin sector, which entered our lives, continues to experience notable developments. Dogecoin almost showed no presence in the recent memecoin hype, which continues to be a topic in various blockchain ecosystems, including the Solana network. So, what is expected for Dogecoin in the upcoming period? Let’s examine together.
随着 2021 年的反弹,进入我们生活的 memecoin 行业继续经历显着的发展。狗狗币在最近的 memecoin 炒作中几乎没有出现,这仍然是包括 Solana 网络在内的各种区块链生态系统中的一个话题。那么,狗狗币在未来一段时间内的预期是什么?我们一起来考察一下。
Dogecoin Chart Analysis
狗狗币图表分析
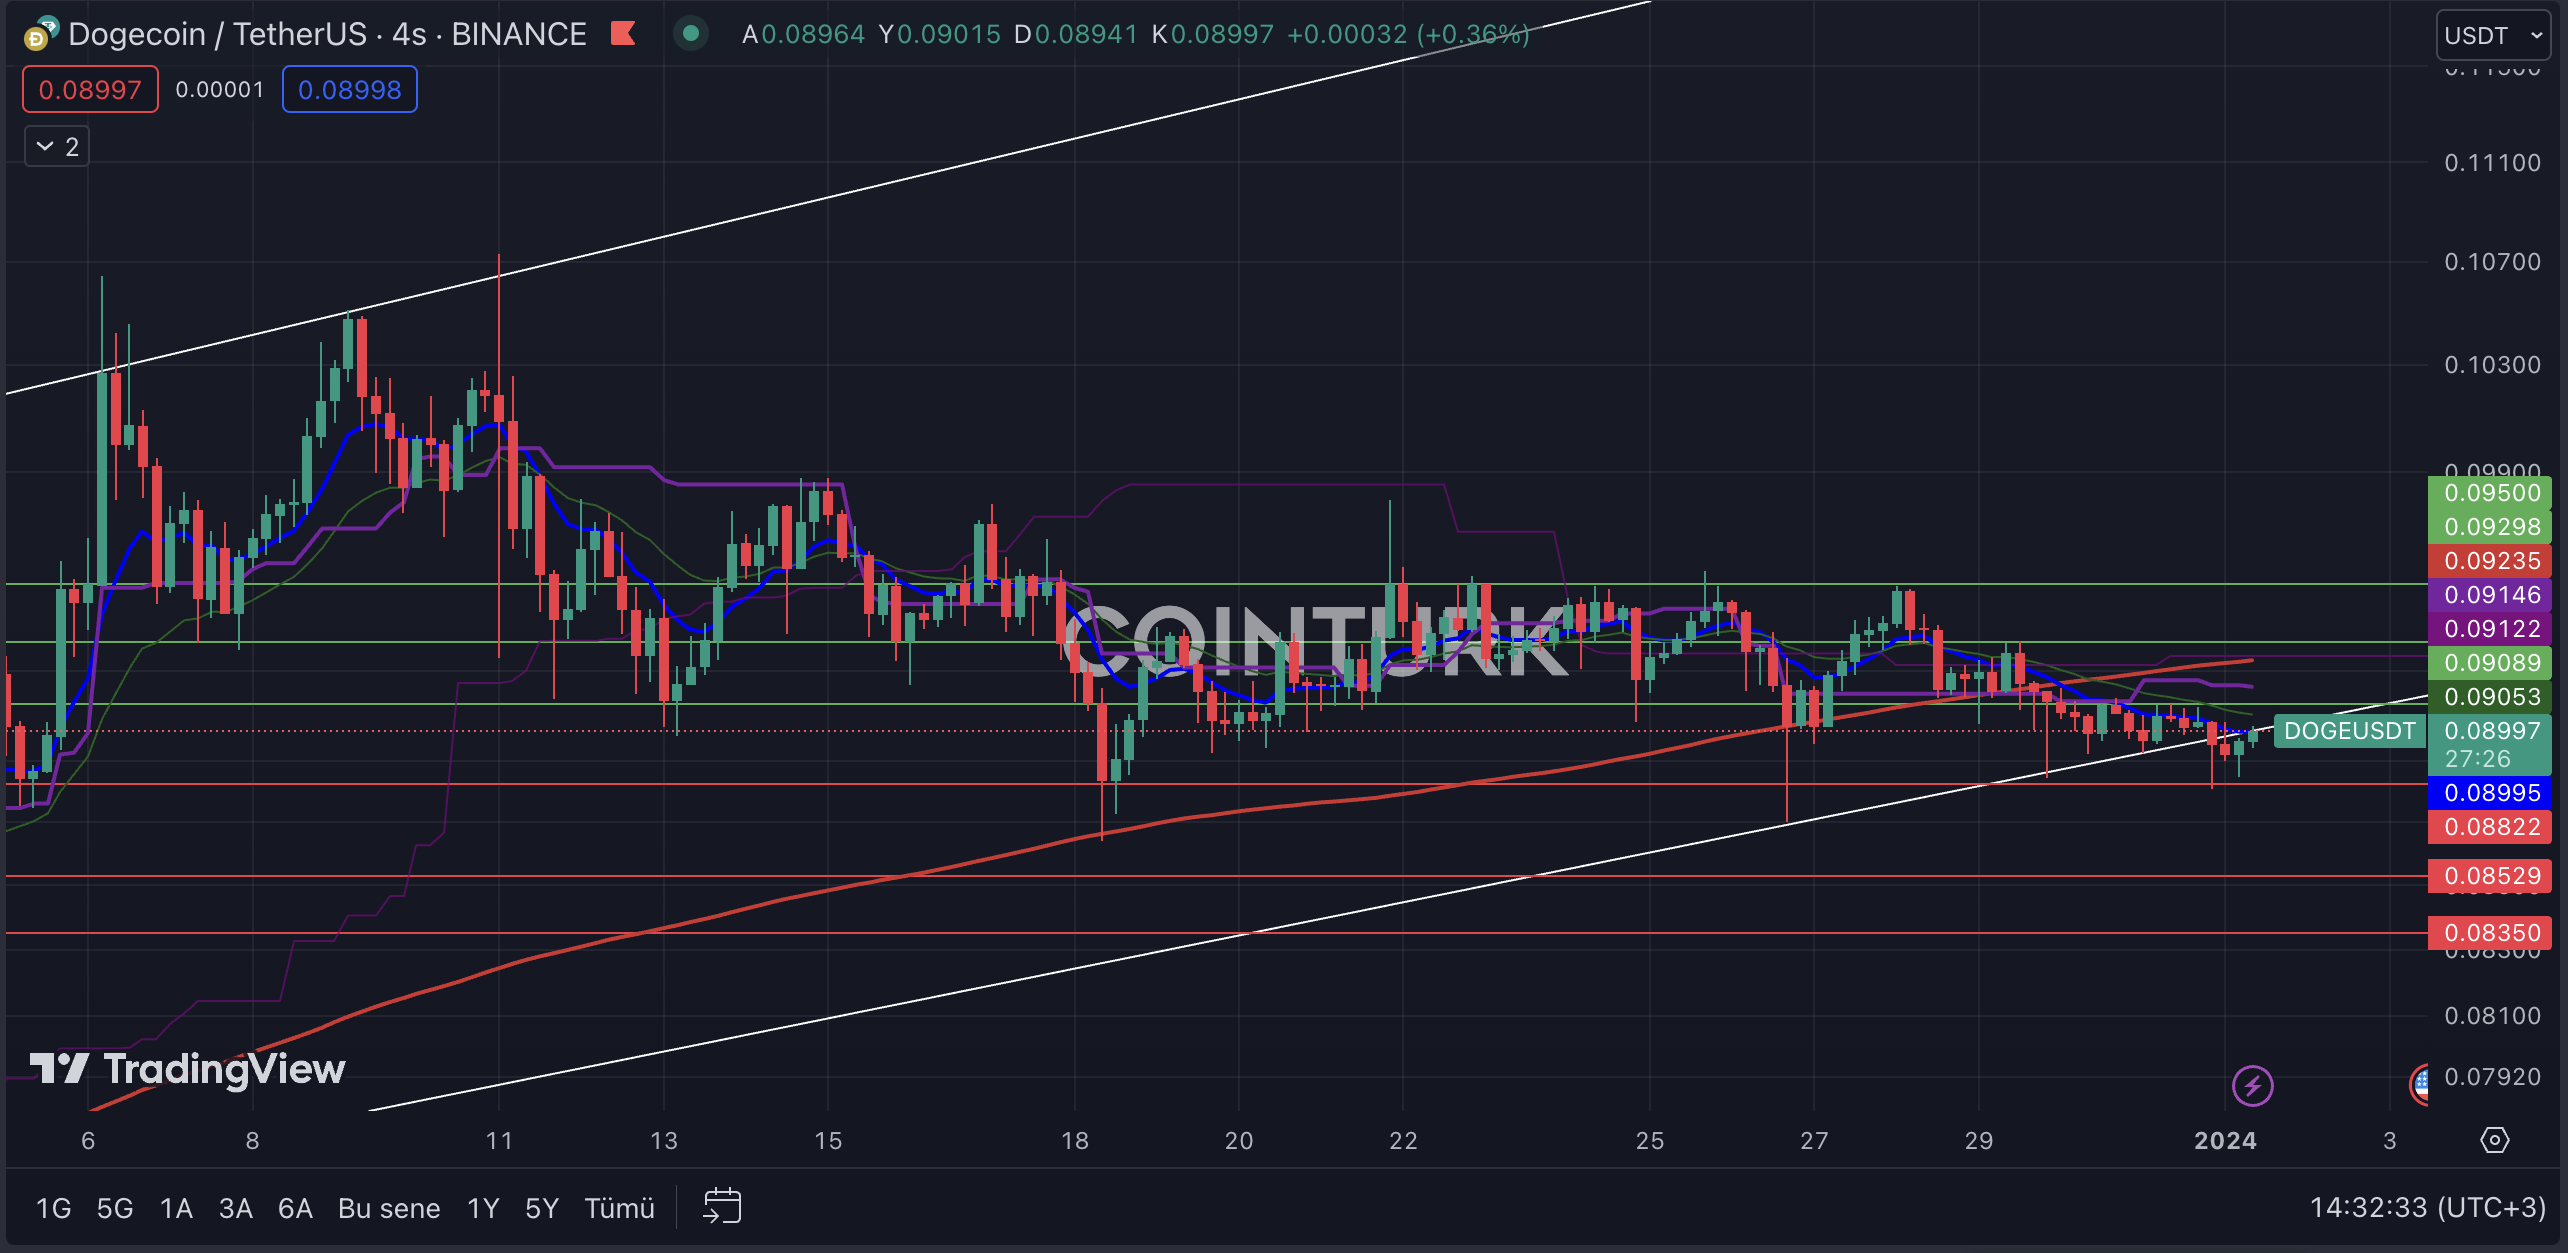
The first noticeable formation structure in the four-hour Dogecoin chart is the ascending channel formation. This structure indicates important clues for investors as there has been no support or resistance break until the last bar formation. However, with the last bars closing below the support line, the possibility of a negative scenario for DOGE in the coming period is increasing.
四小时狗狗币图表中第一个值得注意的形成结构是上升通道形成。这种结构为投资者提供了重要线索,因为直到最后一根柱形形成之前都没有突破支撑或阻力。然而,随着最后一根柱线收于支撑线下方,DOGE 在未来一段时间内出现负面情况的可能性正在增加。
The most important support levels to watch on the four-hour Dogecoin chart are; $0.08822, $0.08529, and $0.08350, respectively. Especially if the closing of the last bars occurs below the crucial $0.08822 level, it will create selling pressure on the DOGE price.
四小时狗狗币图表上值得关注的最重要的支撑位是:分别为 0.08822 美元、0.08529 美元和 0.08350 美元。特别是如果最后一根柱的收盘价低于关键的 0.08822 美元水平,则会对 DOGE 价格造成抛售压力。
On the other hand, the most important resistance levels to follow on the four-hour DOGE chart are; $0.09089, $0.09298, and $0.09500, respectively. A four-hour bar closing above the $0.09089 level, which intersects with EMA 21 (blue line), will allow DOGE to trade back within the formation zone and keep the recent break as a bear trap.
另一方面,四小时 DOGE 图表上最重要的阻力位是:分别为 0.09089 美元、0.09298 美元和 0.09500 美元。四小时柱线收于 0.09089 美元上方,与 EMA 21(蓝线)相交,将使 DOGE 能够在形成区域内进行交易,并将最近的突破视为空头陷阱。
Dogecoin Weekly Chart Analysis
狗狗币每周图表分析
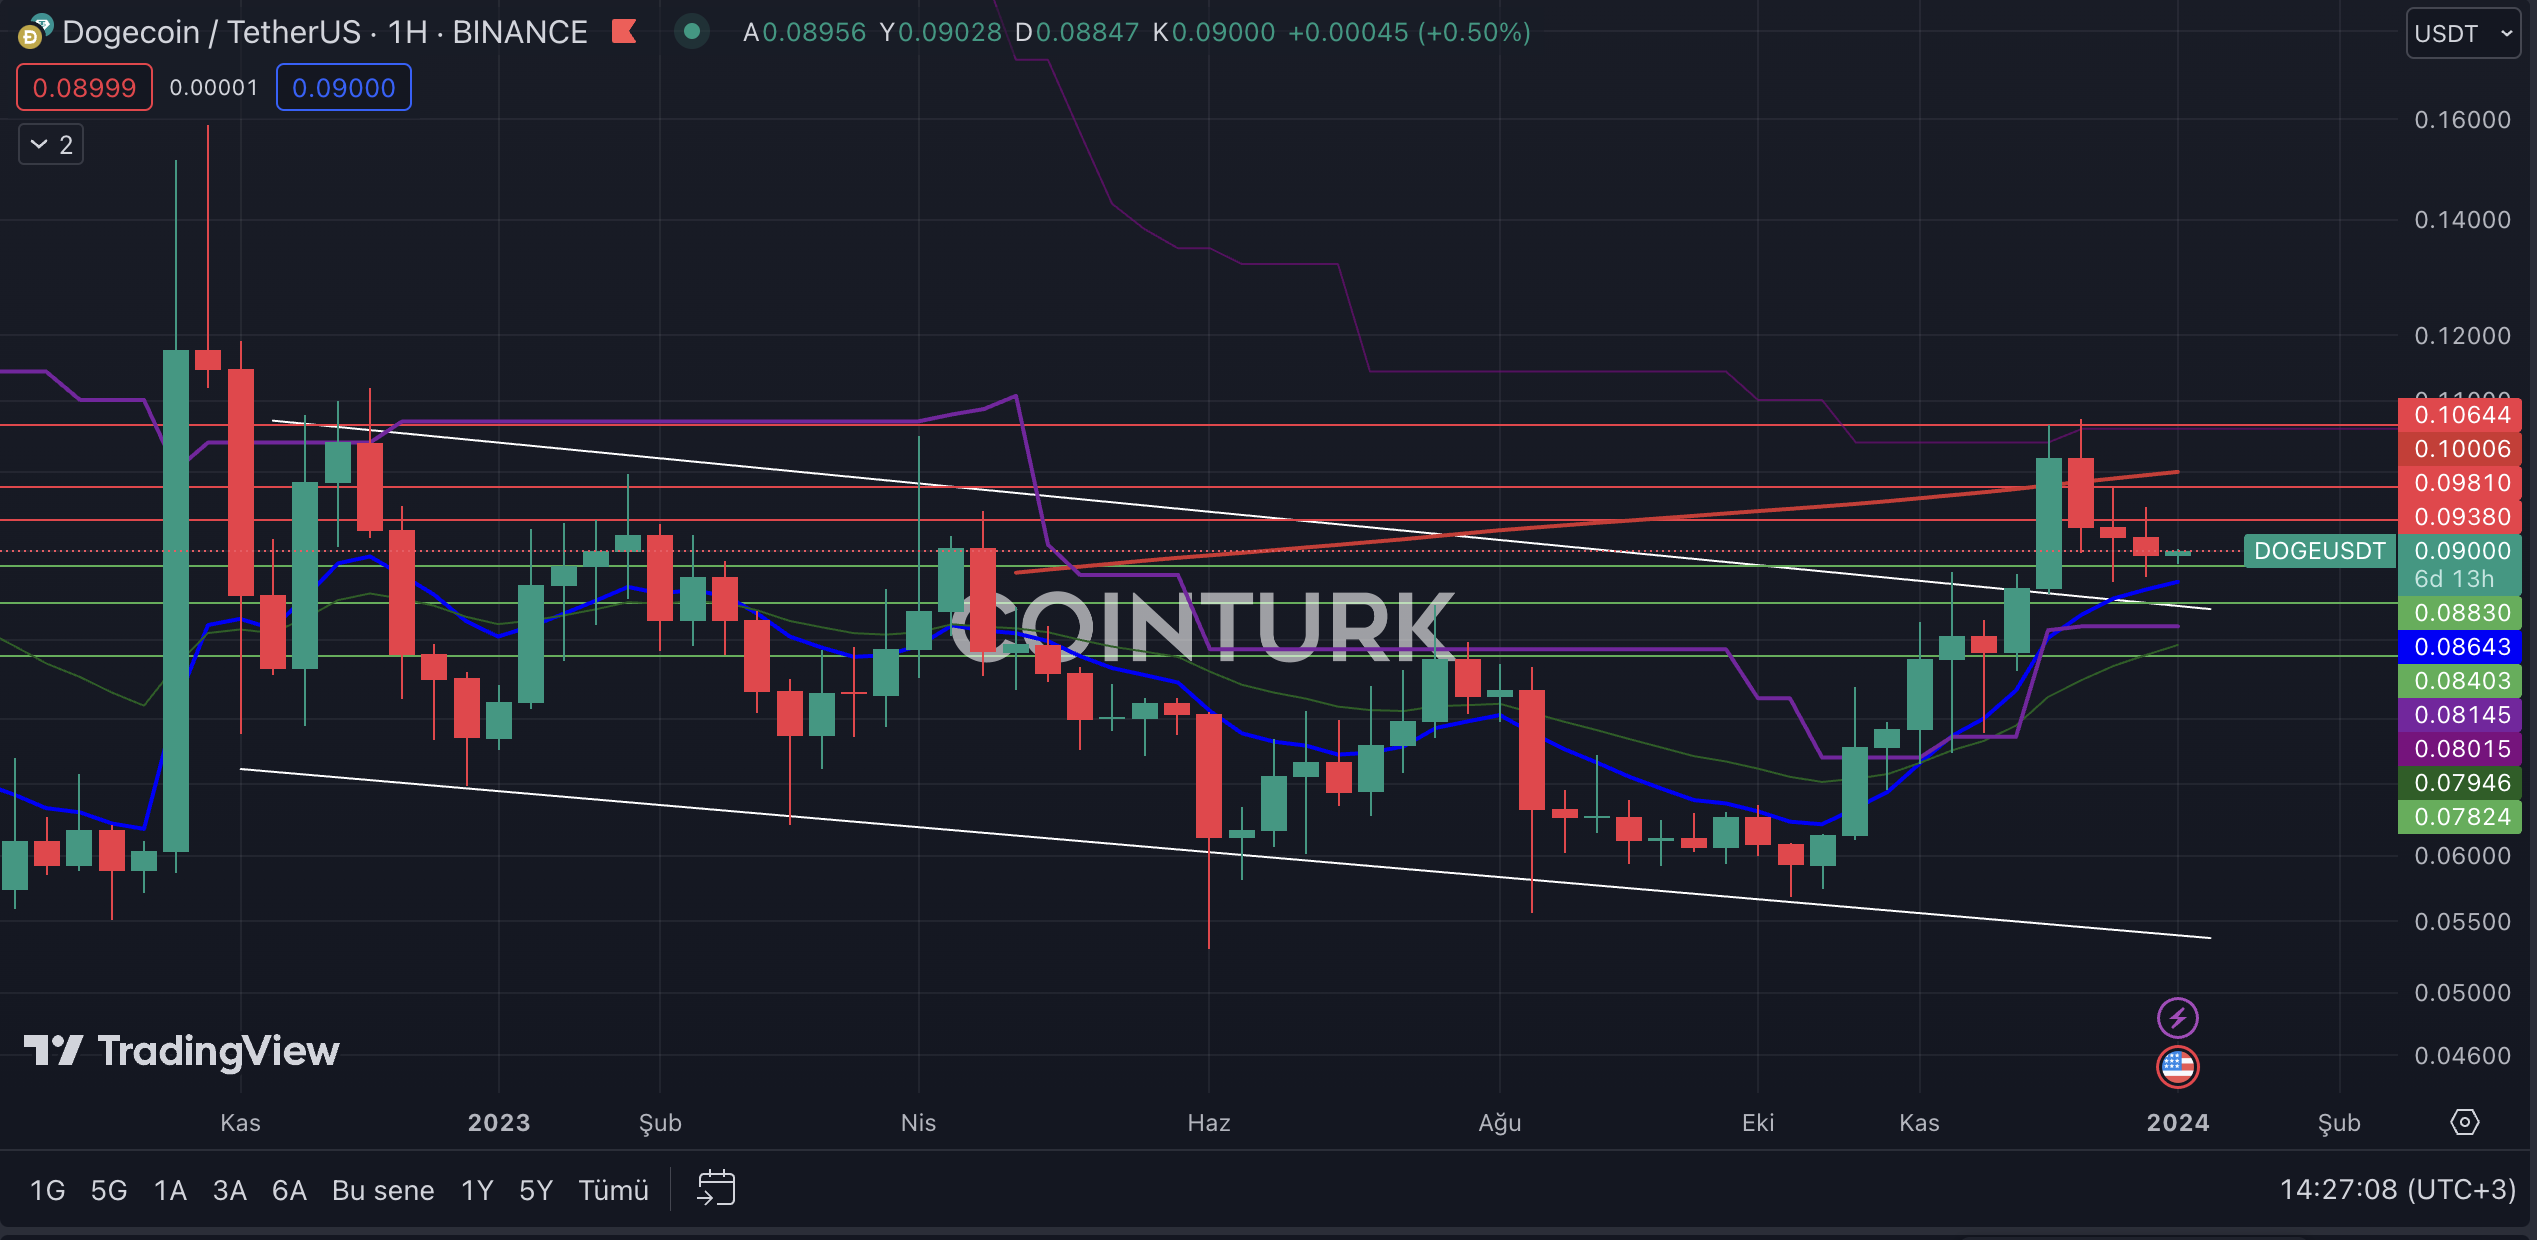
The first noticeable formation structure in the weekly Dogecoin chart is the descending channel formation, which led to an upward movement with the resistance break that occurred last month. However, the EMA 200 (red line) acting as resistance has led to selling pressure on DOGE, and the price continues to trade above the resistance line for now.
狗狗币每周图表中第一个值得注意的形成结构是下降通道形成,它导致上个月发生的阻力突破后向上运动。然而,200 EMA(红线)作为阻力,导致 DOGE 面临抛售压力,目前价格继续在阻力线上方交易。
The most important support levels for Dogecoin to watch are; $0.08830, $0.08403, and $0.07824, respectively. Particularly, a weekly bar closing below the significant $0.08830 level in recent weeks will cause DOGE’s price to lose momentum.
狗狗币最值得关注的支撑位是:分别为 0.08830 美元、0.08403 美元和 0.07824 美元。特别是,最近几周收盘价低于 0.08830 美元的周线将导致 DOGE 的价格失去动力。
The most important resistance levels to follow on the weekly chart for Dogecoin are; $0.09380, $0.09810, and $0.10644, respectively. Especially a weekly bar closing above the $0.09810 level, which intersects with EMA 200, will help DOGE’s price gain momentum.
狗狗币周线图上最重要的阻力位是:分别为 0.09380 美元、0.09810 美元和 0.10644 美元。尤其是周线收盘价高于 0.09810 美元(与 EMA 200 相交),将有助于 DOGE 的价格获得动力。
The post first appeared on COINTURK NEWS: Dogecoin Technical Analysis: A Closer Look at the Trend
该帖子首次出现在 COINTURK 新闻上:狗狗币技术分析:仔细观察趋势
 Crypto News Flash
 DogeHome
 Crypto News Flash
 Crypto News Flash
 DeFi Planet
 crypto.news
 Crypto Intelligence News
 DogeHome
 The Crypto Times


