In the cryptocurrency market, technical analysis emerges as an indicator that investors, especially those in the futures market, must continuously monitor. So, what clues does the technical analysis provide for Dogecoin, which was trading at $0.09408 at the time the article was written? We examine it in detail, along with the important support and resistance levels.
Dogecoin Chart Analysis
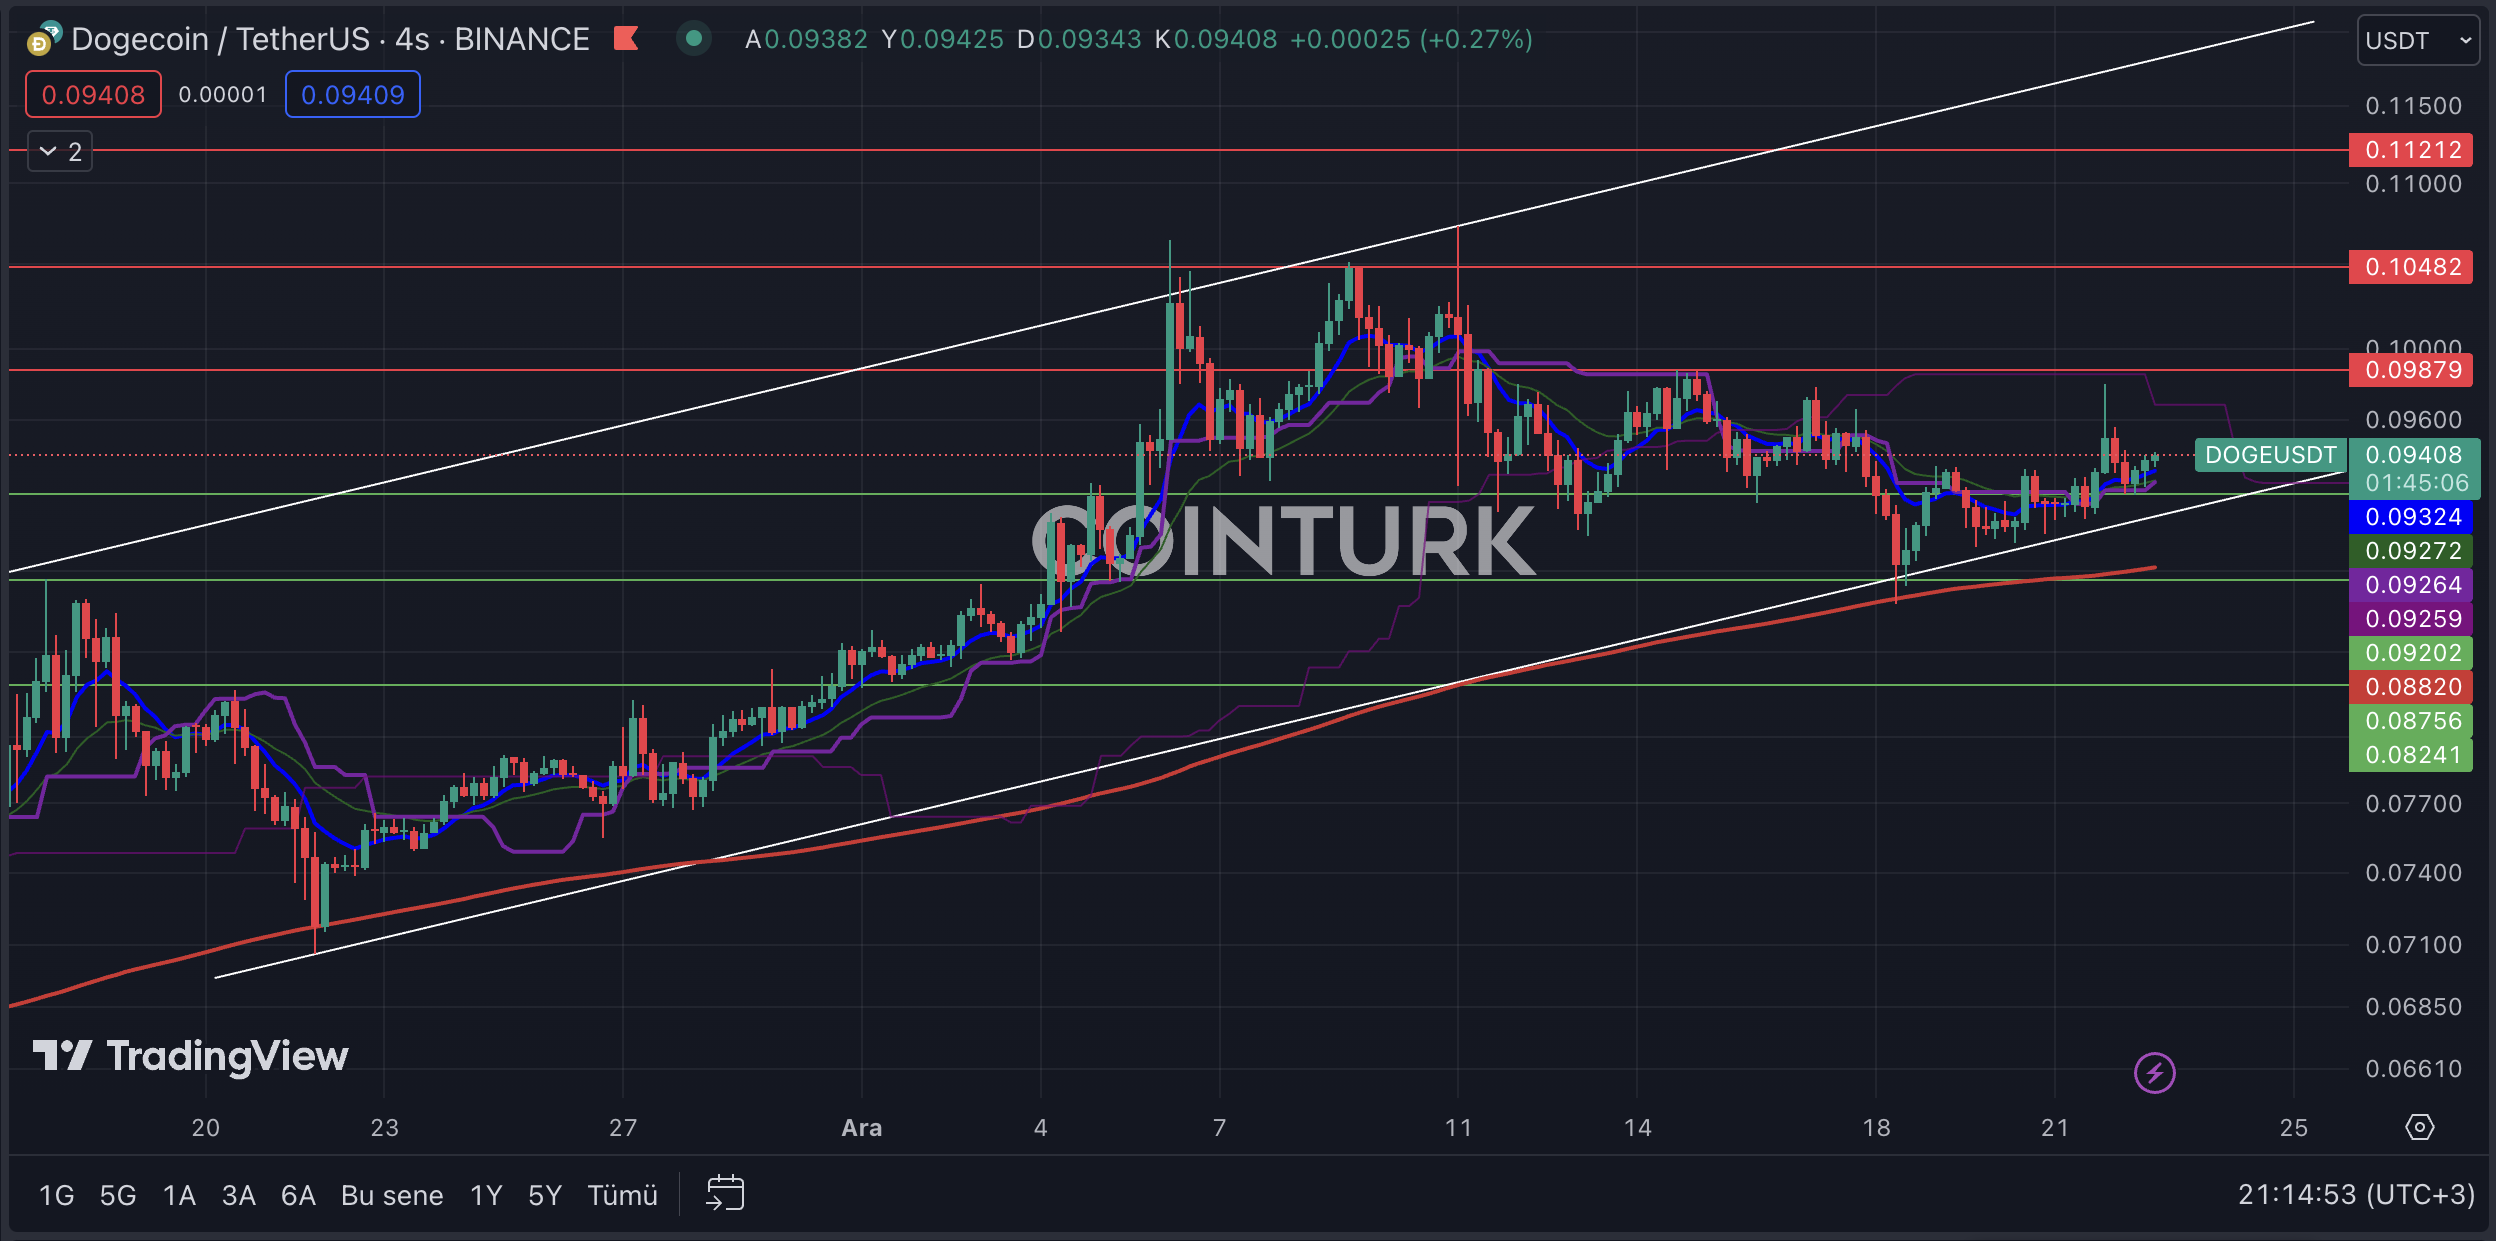
The four-hour Dogecoin chart highlights a rising channel formation. The absence of a support or resistance breakout in the formation structure provides an important clue, especially for futures traders. The intersection of the support line with the EMA 200 (red line) suggests a positive scenario for the price of Dogecoin.
The most important support levels to watch on the Dogecoin chart are; $0.09202, $0.08756, and $0.08241, respectively. Particularly, a four-hour bar closing below the $0.08756 level, which intersects both the formation support line and the EMA 200 level, will cause significant selling pressure on the Dogecoin price.
The most important resistance levels to watch on the Dogecoin chart are; $0.09879, $0.10482, and $0.11212, respectively. Especially, a four-hour bar closing above the $0.09879 level, which has been a significant barrier since December 11, will accelerate the momentum of the Dogecoin price.

Dogecoin Weekly Chart Analysis
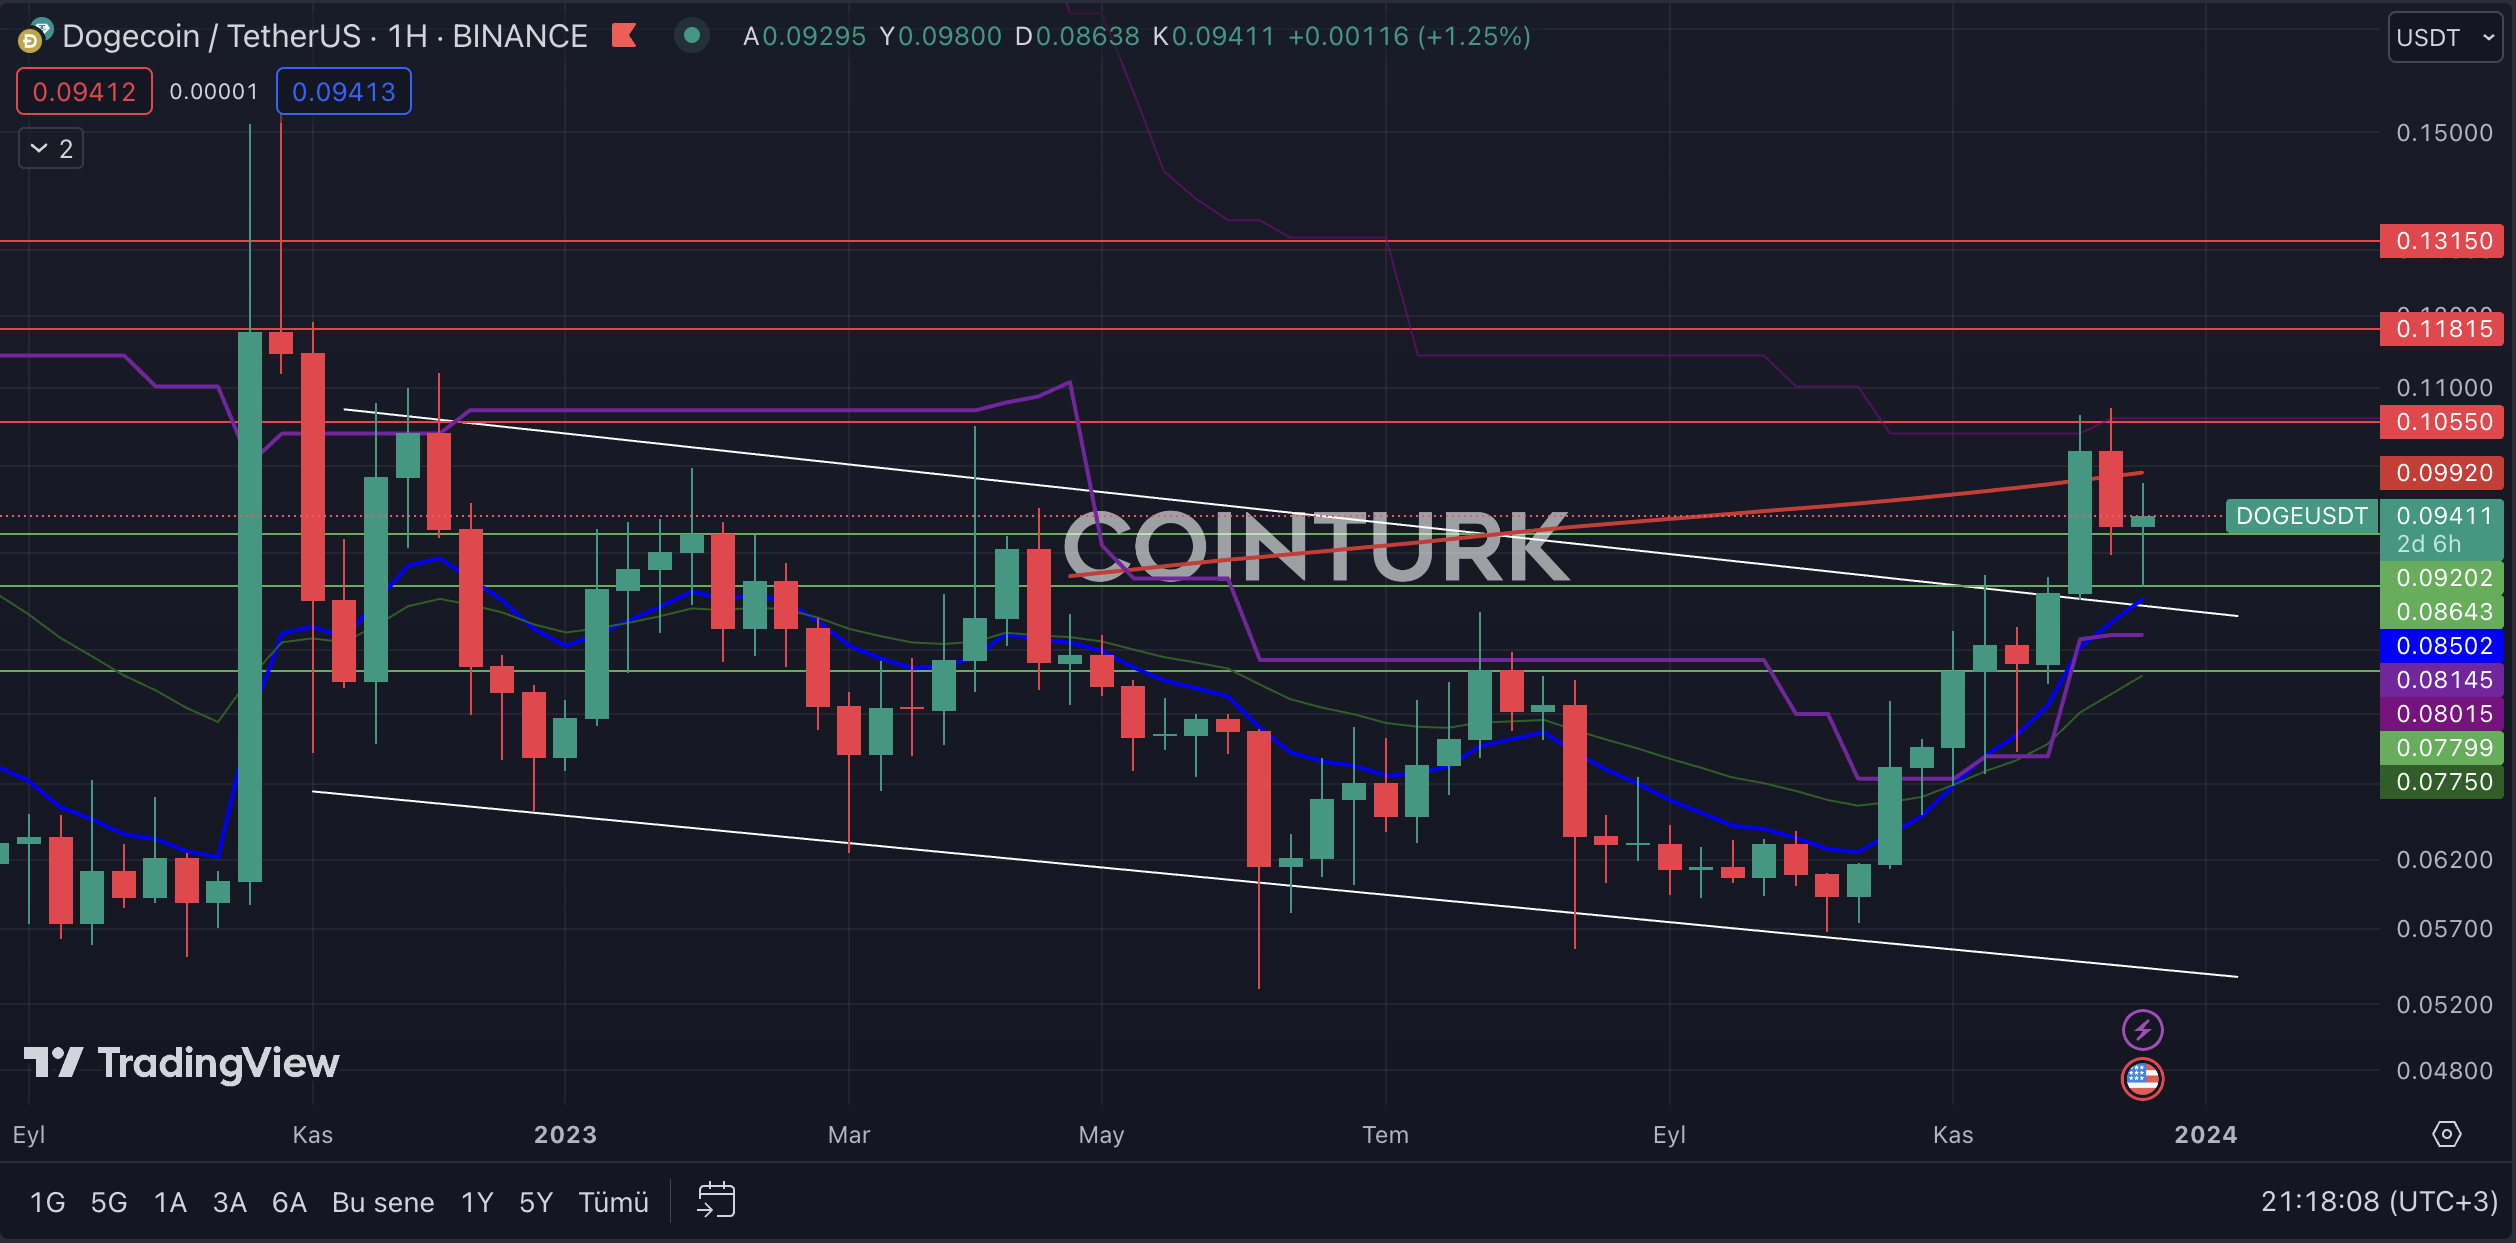
The first notable formation structure in the Dogecoin weekly chart analysis is a descending channel formation. This formation structure successfully completed a resistance breakout in recent weeks, and since then, the Dogecoin price has continued to gain strength. Particularly, the resistance line acting as support reflects a positive process for Dogecoin.
The most important support levels to watch on the Dogecoin weekly chart are; $0.09202, $0.08643, and $0.07799, respectively. Especially, a weekly bar closing below the $0.08643 level, which intersects with the resistance line, could lead to selling pressure on the Dogecoin price.
The most important resistance levels to watch on the Dogecoin weekly chart are; $0.10550, $0.11815, and $0.13150, respectively. Especially, a weekly bar closing above the $0.10550 level, which has been a significant barrier for the last two weeks, will accelerate the momentum of the Dogecoin price.


 DogeHome
 Optimisus
 Crypto News Land
 Optimisus
 Cryptopolitan_News
 Cryptopolitan
 crypto.ro English


