

In the cryptocurrency market, technical analysis emerges as an indicator that investors, especially those in the futures market, must continuously monitor. So, what clues does the technical analysis provide for Dogecoin, which was trading at $0.09408 at the time the article was written? We examine it in detail, along with the important support and resistance levels.
在加密货币市场中,技术分析成为投资者,尤其是期货市场投资者必须持续监控的指标。那么,技术分析为狗狗币(在撰写本文时交易价格为 0.09408 美元)提供了哪些线索呢?我们详细研究它以及重要的支撑位和阻力位。
Dogecoin Chart Analysis
狗狗币图表分析
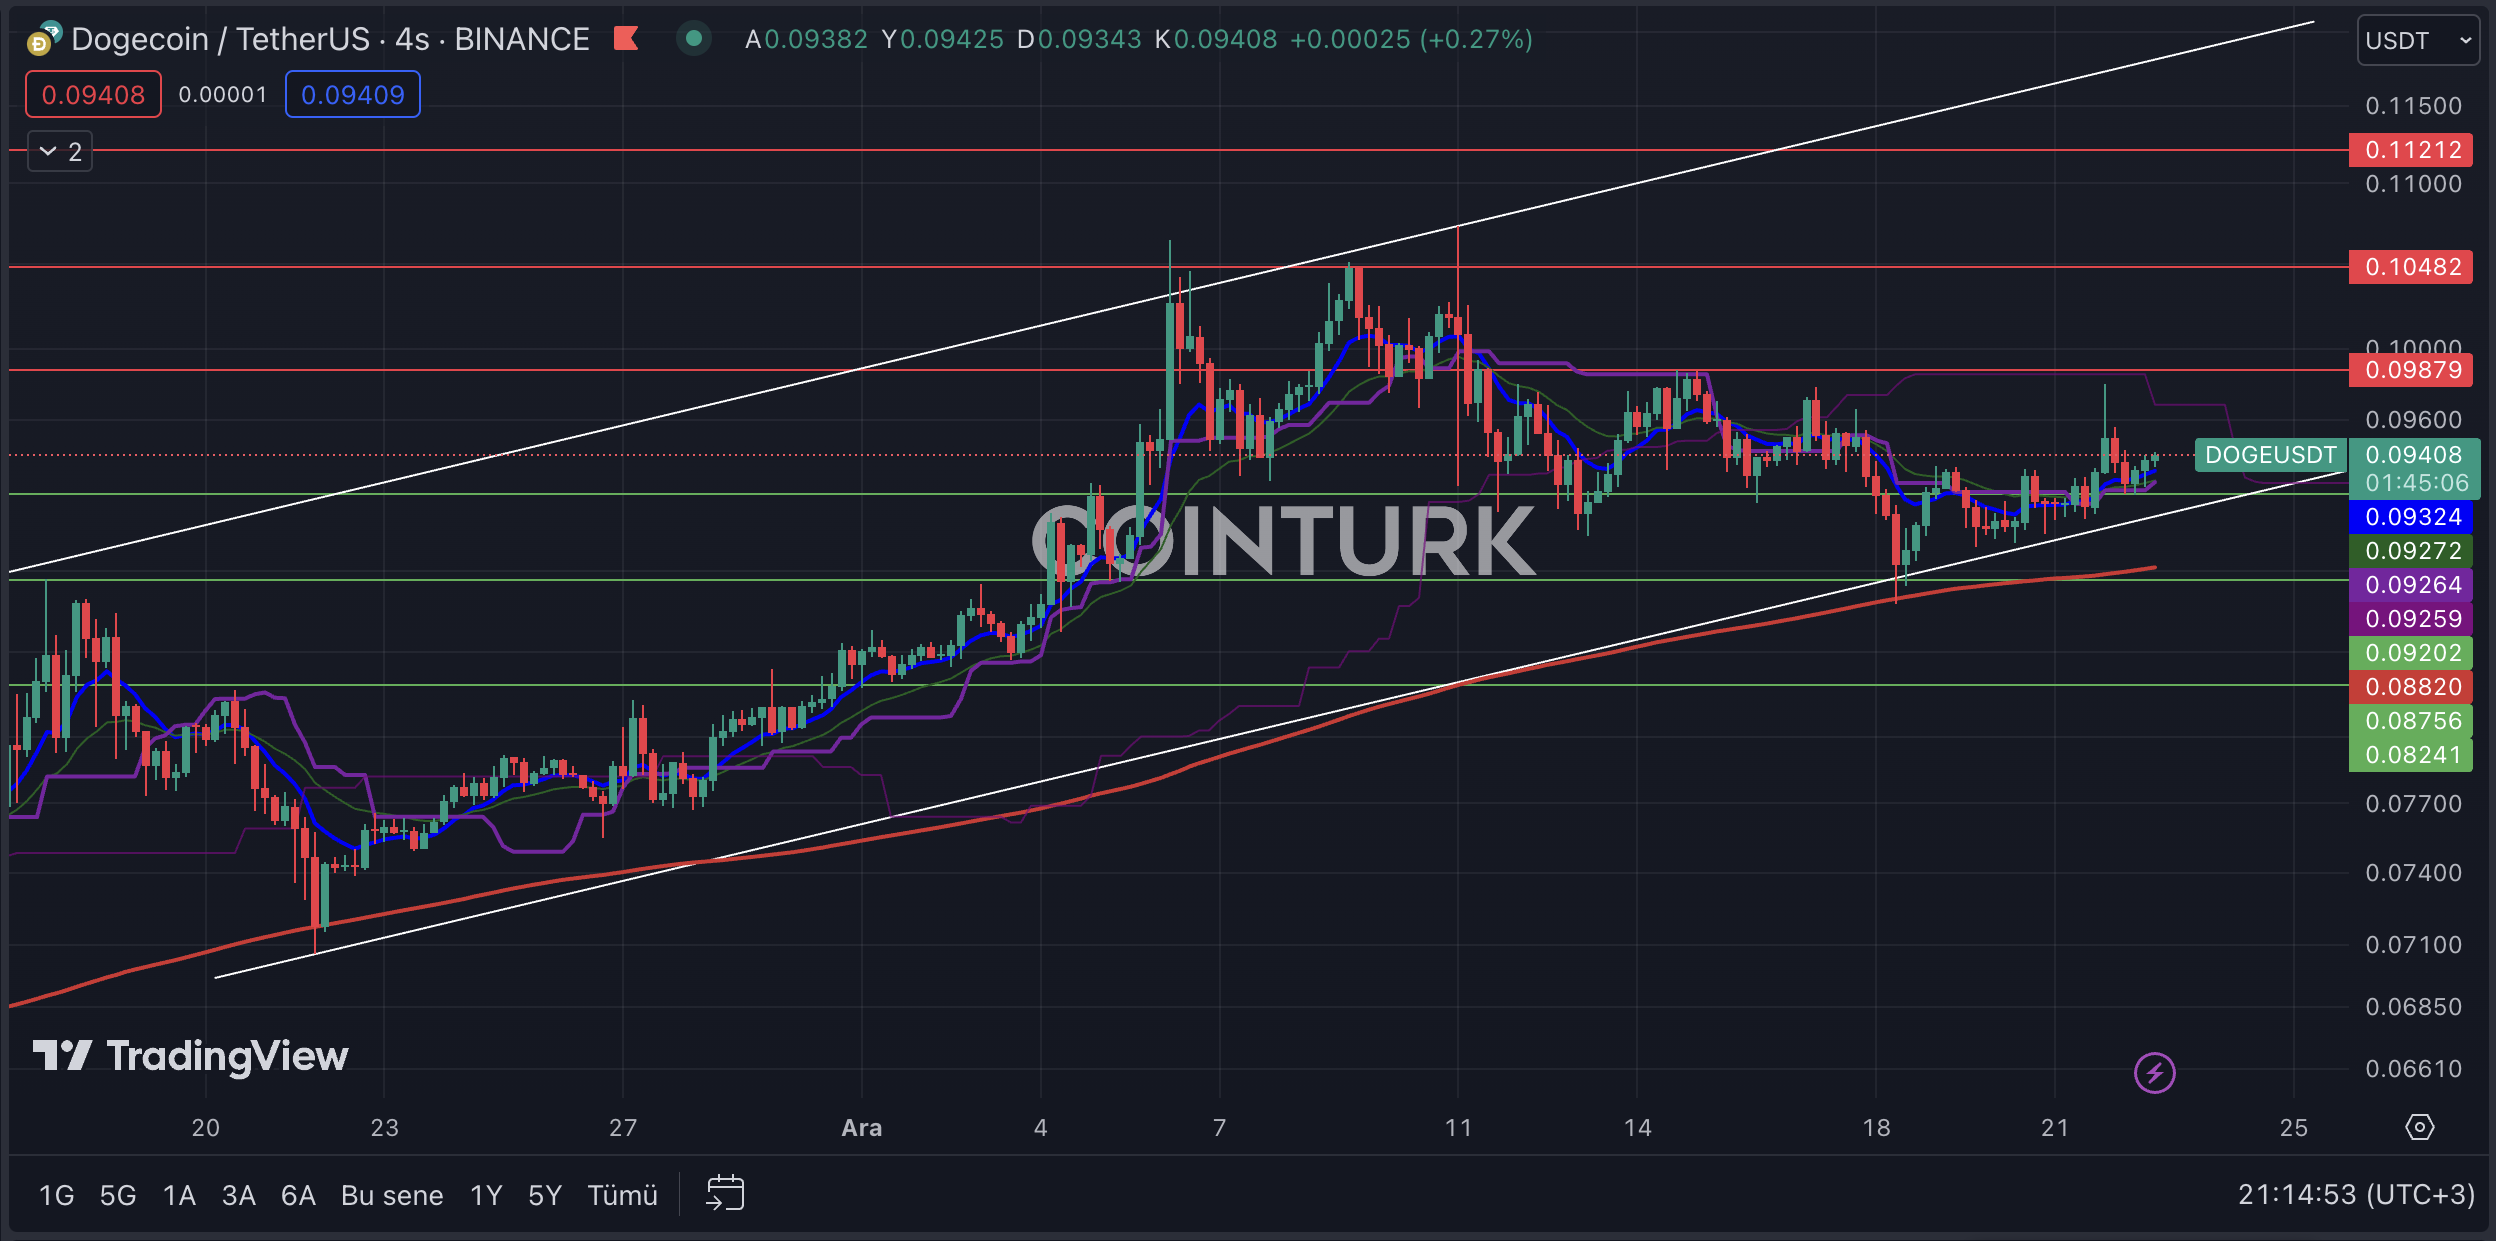
The four-hour Dogecoin chart highlights a rising channel formation. The absence of a support or resistance breakout in the formation structure provides an important clue, especially for futures traders. The intersection of the support line with the EMA 200 (red line) suggests a positive scenario for the price of Dogecoin.
四小时狗狗币图表凸显了上升通道的形成。形态结构中缺乏支撑或阻力突破提供了重要线索,特别是对于期货交易者而言。支撑线与 EMA 200(红线)的交叉点表明狗狗币的价格出现积极的情况。
The most important support levels to watch on the Dogecoin chart are; $0.09202, $0.08756, and $0.08241, respectively. Particularly, a four-hour bar closing below the $0.08756 level, which intersects both the formation support line and the EMA 200 level, will cause significant selling pressure on the Dogecoin price.
狗狗币图表上值得关注的最重要的支撑位是:分别为 0.09202 美元、0.08756 美元和 0.08241 美元。特别是,收盘价低于 0.08756 美元水平(与形成支撑线和 EMA 200 水平相交)的四小时柱线将对狗狗币价格造成巨大的抛售压力。
The most important resistance levels to watch on the Dogecoin chart are; $0.09879, $0.10482, and $0.11212, respectively. Especially, a four-hour bar closing above the $0.09879 level, which has been a significant barrier since December 11, will accelerate the momentum of the Dogecoin price.
狗狗币图表上最重要的阻力位是:分别为 0.09879 美元、0.10482 美元和 0.11212 美元。特别是,收盘价高于 0.09879 美元的四小时柱线(自 12 月 11 日以来一直是一个重要障碍)将加速狗狗币价格的上涨势头。
Dogecoin Weekly Chart Analysis
狗狗币每周图表分析
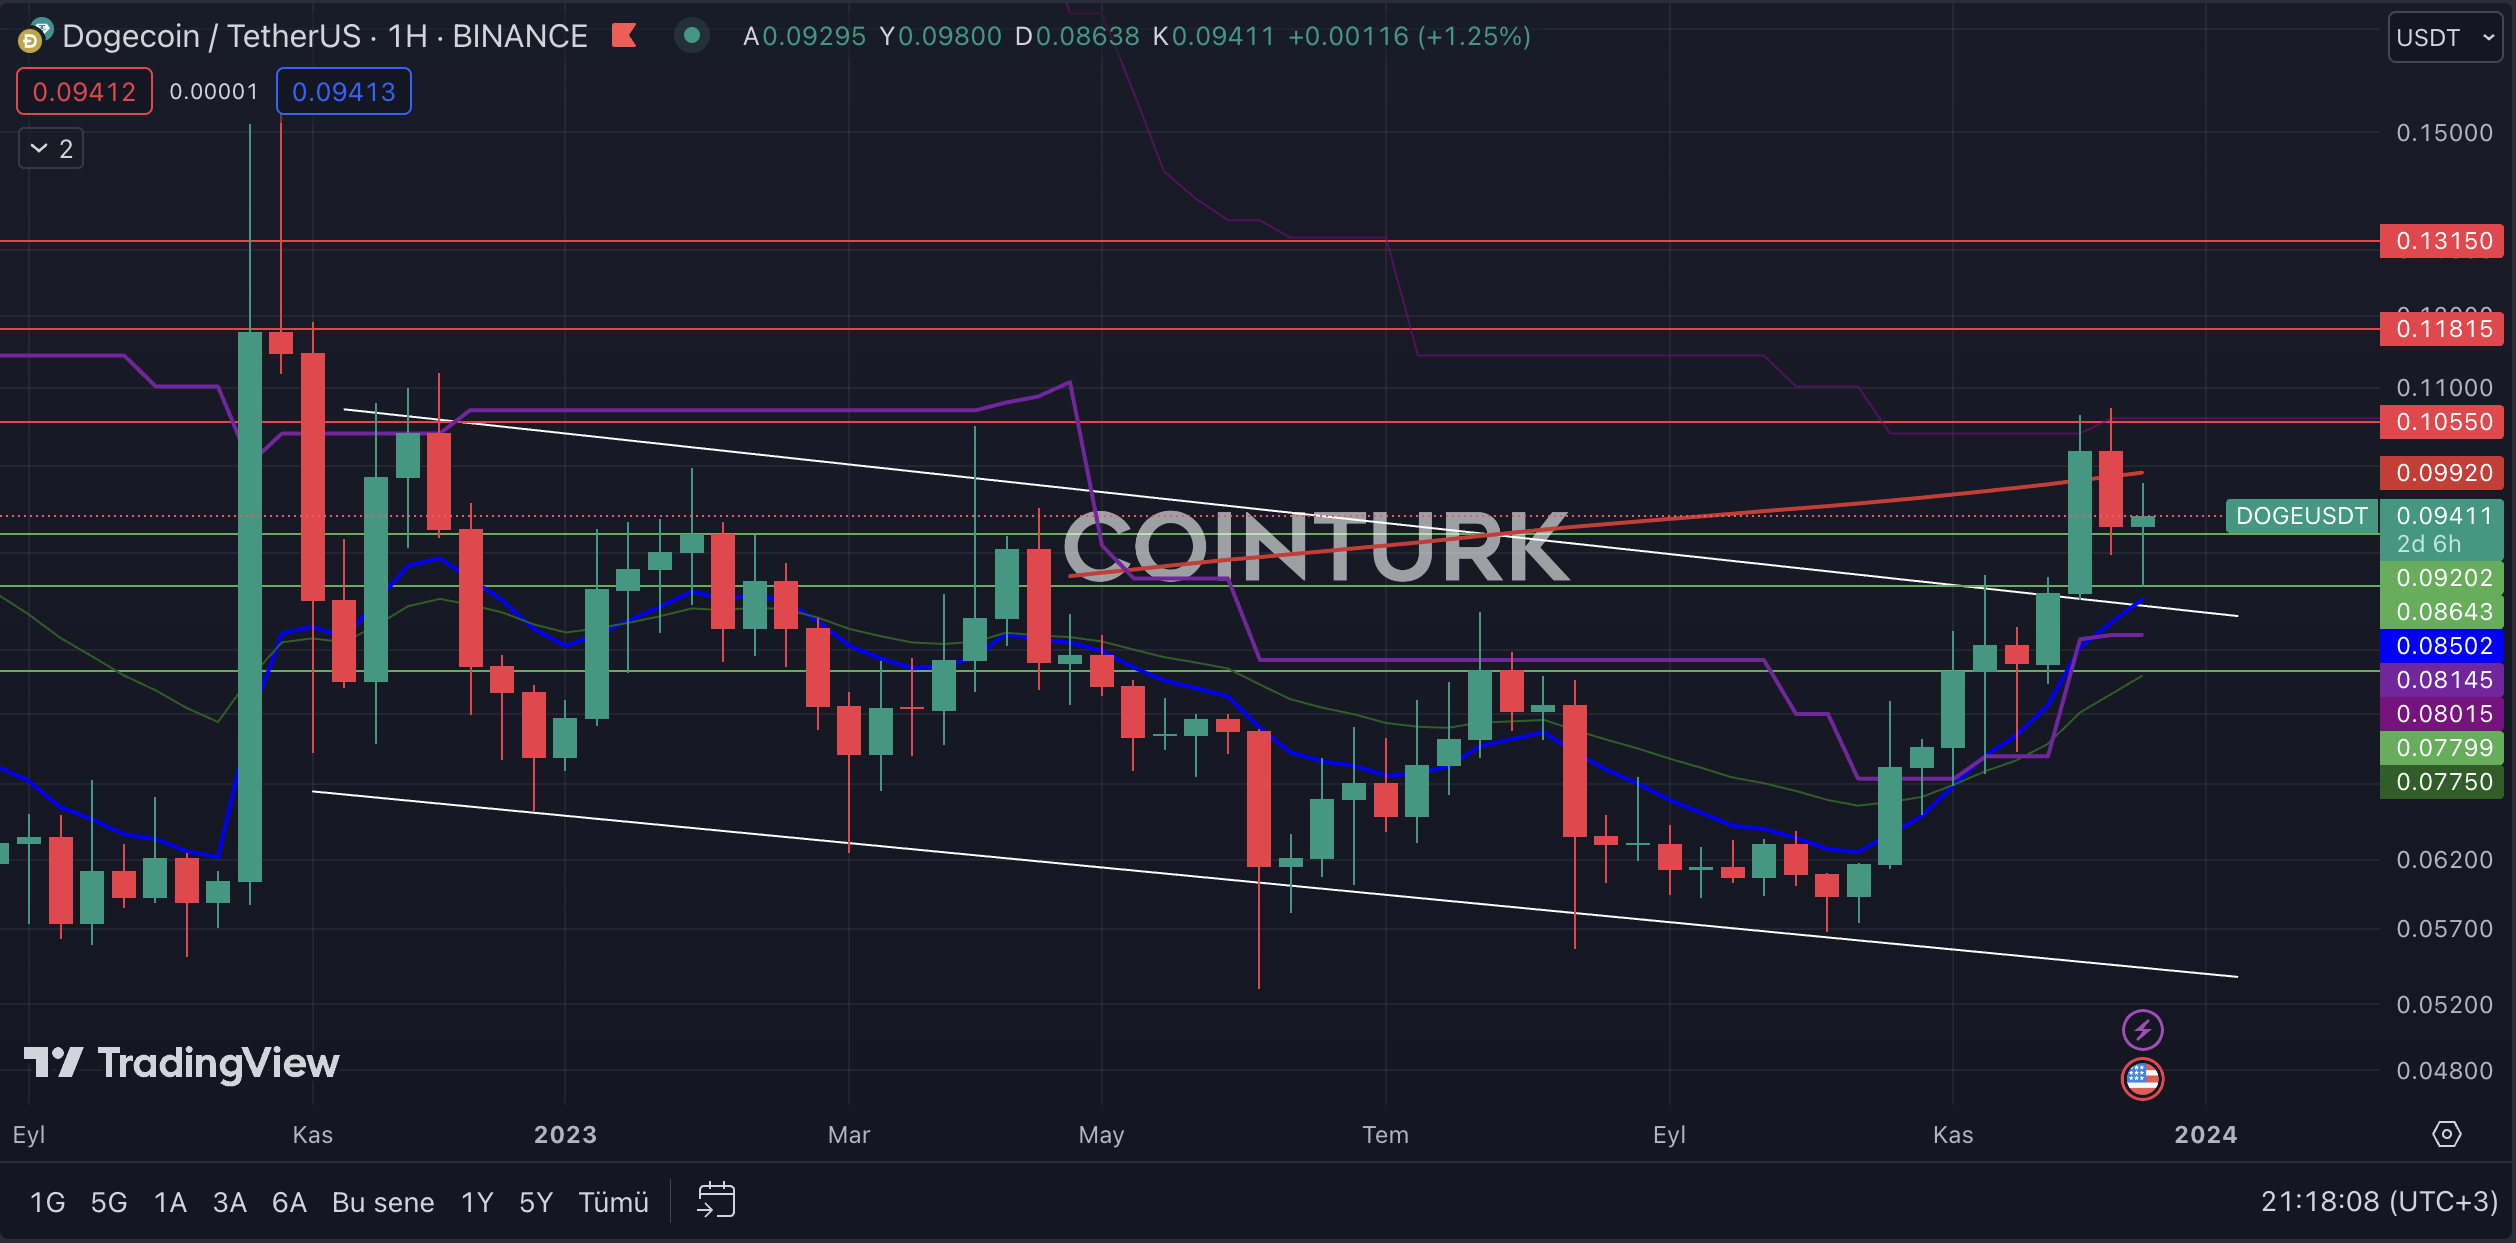
The first notable formation structure in the Dogecoin weekly chart analysis is a descending channel formation. This formation structure successfully completed a resistance breakout in recent weeks, and since then, the Dogecoin price has continued to gain strength. Particularly, the resistance line acting as support reflects a positive process for Dogecoin.
狗狗币周线图分析中第一个值得注意的形态结构是下降通道形态。这种形成结构在最近几周成功完成了阻力突破,此后,狗狗币价格持续走强。特别是,作为支撑的阻力线反映了狗狗币的积极过程。
The most important support levels to watch on the Dogecoin weekly chart are; $0.09202, $0.08643, and $0.07799, respectively. Especially, a weekly bar closing below the $0.08643 level, which intersects with the resistance line, could lead to selling pressure on the Dogecoin price.
狗狗币周线图上值得关注的最重要的支撑位是:分别为 0.09202 美元、0.08643 美元和 0.07799 美元。特别是,周线收盘价低于与阻力线相交的 0.08643 美元水平,可能会导致狗狗币价格面临抛售压力。
The most important resistance levels to watch on the Dogecoin weekly chart are; $0.10550, $0.11815, and $0.13150, respectively. Especially, a weekly bar closing above the $0.10550 level, which has been a significant barrier for the last two weeks, will accelerate the momentum of the Dogecoin price.
狗狗币周线图上最重要的阻力位是:分别为 0.10550 美元、0.11815 美元和 0.13150 美元。特别是,每周收盘价高于 0.10550 美元的水平(过去两周一直是一个重大障碍)将加速狗狗币价格的上涨势头。
继续阅读:https://en.coin-turk.com/dogecoin-technical-analysis-overview/
 Coincu
 DogeHome
 BlockchainReporter
 CoinPedia News
 TheNewsCrypto
 CFN
CFN Optimisus


