In the cryptocurrency market, technical analysis emerges as an indicator that investors, especially those in the futures market, must continuously monitor. So, what clues does the technical analysis provide for Dogecoin, which was trading at $0.09408 at the time the article was written? We examine it in detail, along with the important support and resistance levels.
암호화폐 시장에서 기술적 분석은 투자자, 특히 선물시장 투자자가 지속적으로 모니터링해야 하는 지표로 등장합니다. 그렇다면 기사가 작성될 당시 0.09408달러에 거래되고 있던 Dogecoin에 대해 기술적 분석은 어떤 단서를 제공합니까? 우리는 중요한 지지 및 저항 수준과 함께 이를 자세히 조사합니다.
Dogecoin Chart Analysis
도지코인 차트 분석
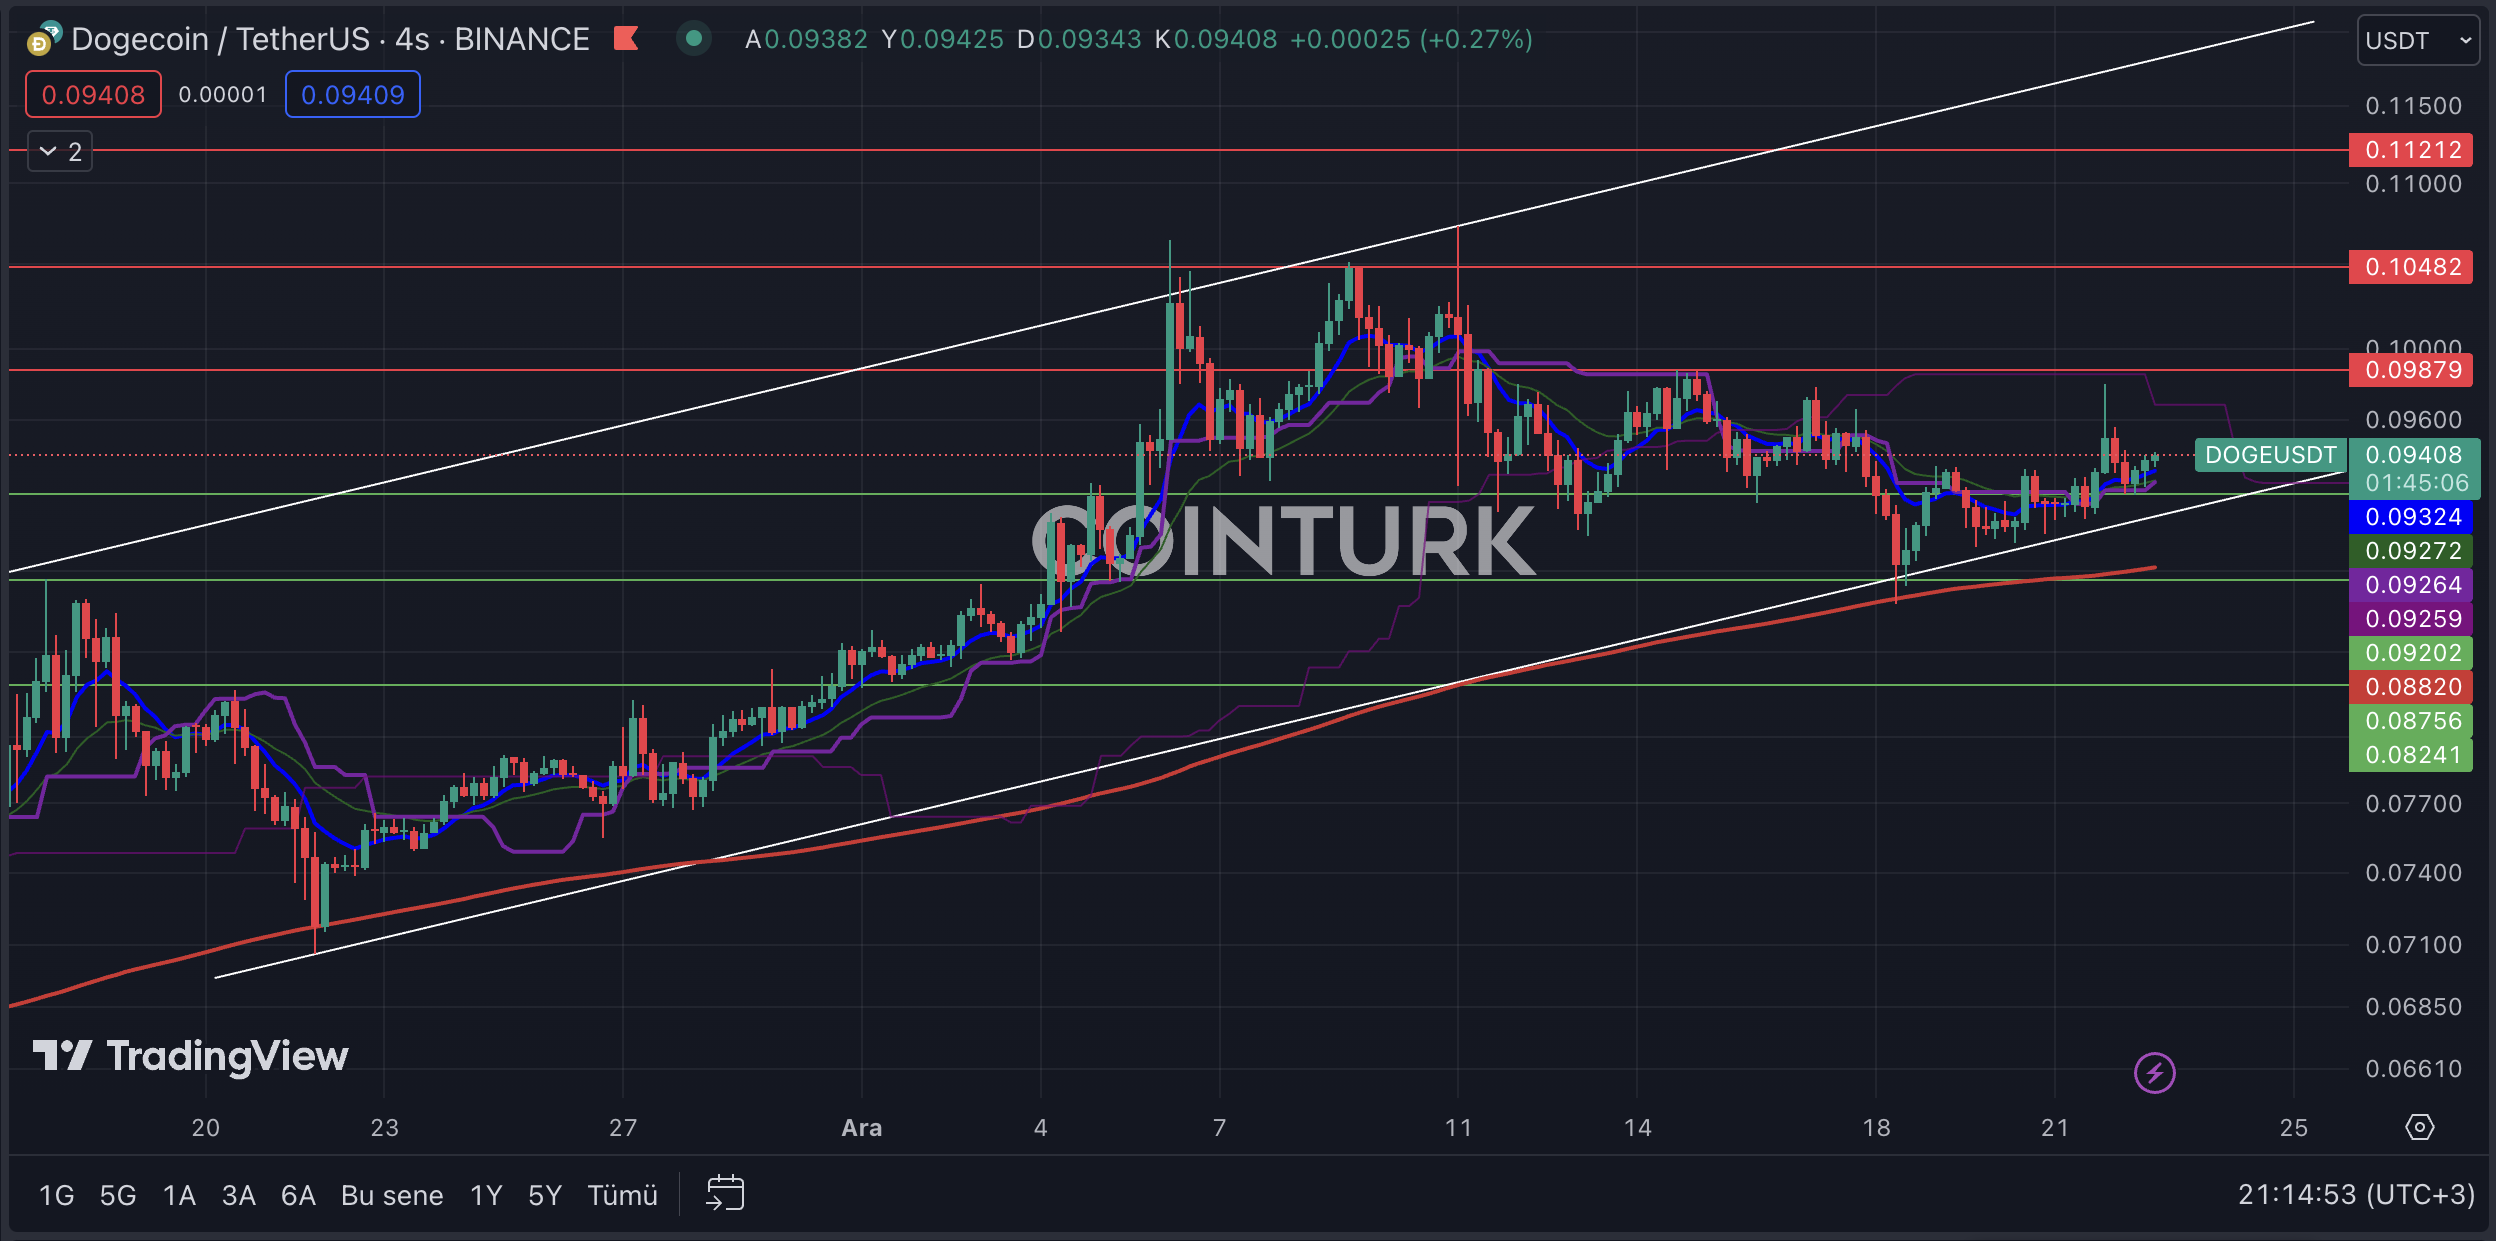
The four-hour Dogecoin chart highlights a rising channel formation. The absence of a support or resistance breakout in the formation structure provides an important clue, especially for futures traders. The intersection of the support line with the EMA 200 (red line) suggests a positive scenario for the price of Dogecoin.
4시간짜리 Dogecoin 차트는 상승하는 채널 형성을 강조합니다. 형성 구조에 지지 또는 저항 돌파가 없다는 것은 특히 선물 거래자에게 중요한 단서를 제공합니다. 지지선과 EMA 200(빨간색 선)의 교차점은 Dogecoin 가격에 대한 긍정적인 시나리오를 암시합니다.
The most important support levels to watch on the Dogecoin chart are; $0.09202, $0.08756, and $0.08241, respectively. Particularly, a four-hour bar closing below the $0.08756 level, which intersects both the formation support line and the EMA 200 level, will cause significant selling pressure on the Dogecoin price.
Dogecoin 차트에서 관찰해야 할 가장 중요한 지원 수준은 다음과 같습니다. 각각 $0.09202, $0.08756, $0.08241입니다. 특히, 형성 지지선과 EMA 200 수준을 모두 교차하는 $0.08756 수준 아래로 마감되는 4시간 막대는 Dogecoin 가격에 상당한 매도 압력을 가할 것입니다.
The most important resistance levels to watch on the Dogecoin chart are; $0.09879, $0.10482, and $0.11212, respectively. Especially, a four-hour bar closing above the $0.09879 level, which has been a significant barrier since December 11, will accelerate the momentum of the Dogecoin price.
Dogecoin 차트에서 관찰해야 할 가장 중요한 저항 수준은 다음과 같습니다. 각각 $0.09879, $0.10482, $0.11212입니다. 특히, 12월 11일 이후 상당한 장벽이었던 $0.09879 수준 위에서 마감되는 4시간 막대는 Dogecoin 가격의 모멘텀을 가속화할 것입니다.

Dogecoin Weekly Chart Analysis
Dogecoin 주간 차트 분석
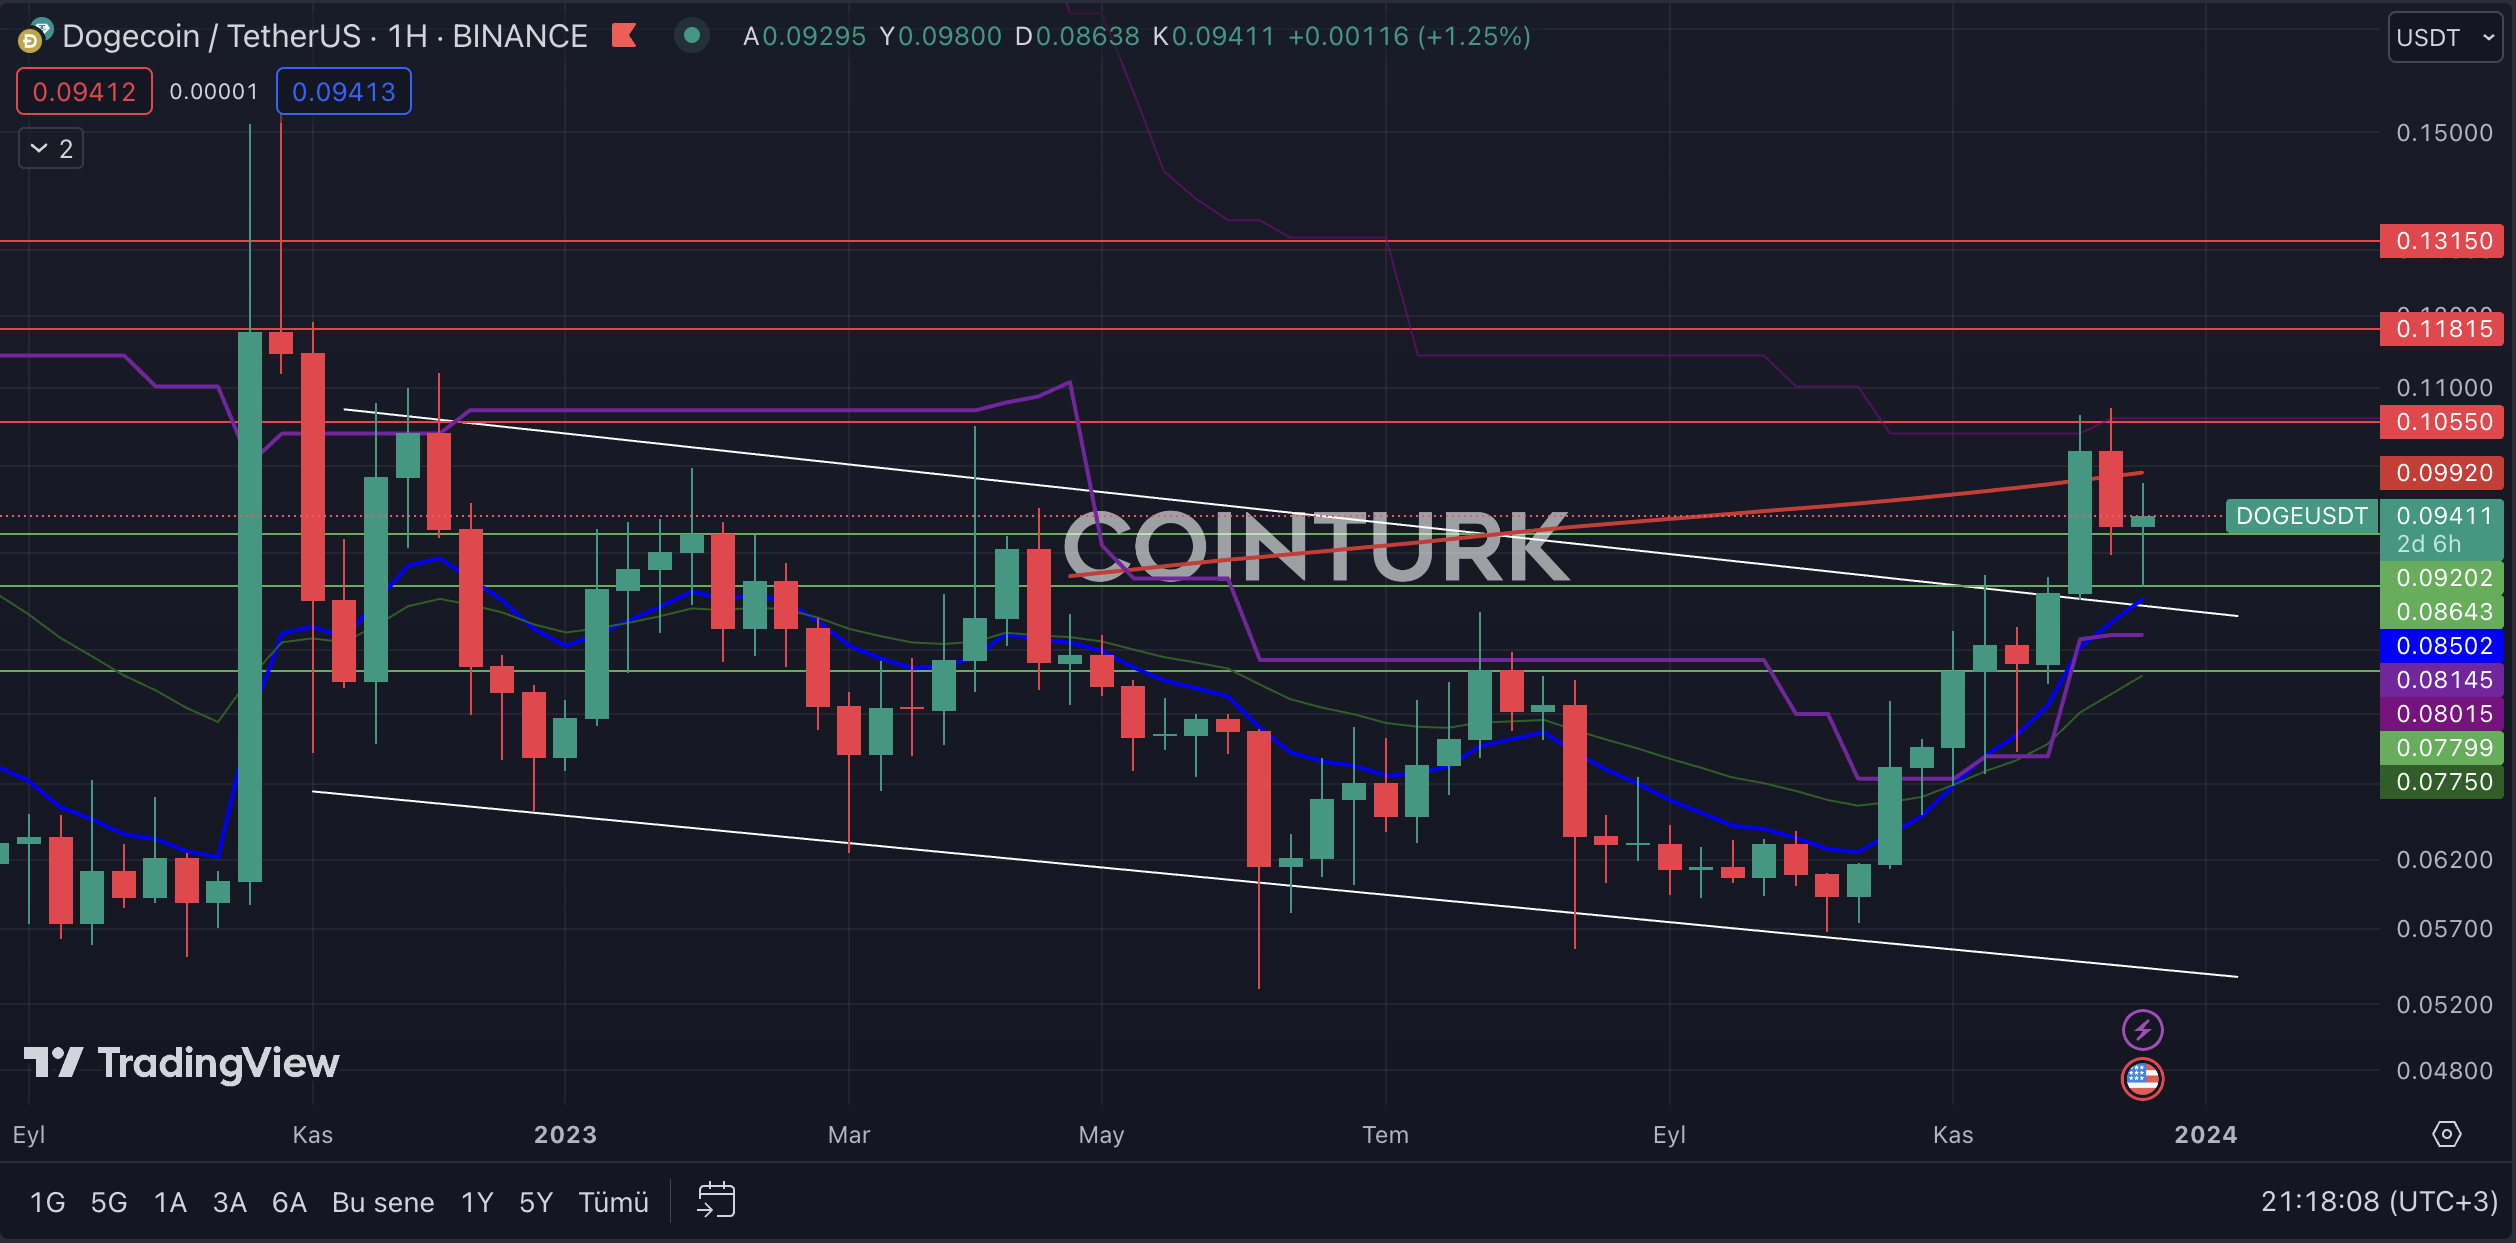
The first notable formation structure in the Dogecoin weekly chart analysis is a descending channel formation. This formation structure successfully completed a resistance breakout in recent weeks, and since then, the Dogecoin price has continued to gain strength. Particularly, the resistance line acting as support reflects a positive process for Dogecoin.
Dogecoin 주간 차트 분석에서 첫 번째 주목할만한 형성 구조는 하강 채널 형성입니다. 이 형성 구조는 최근 몇 주 동안 저항 돌파를 성공적으로 완료했으며 그 이후로 Dogecoin 가격은 계속해서 강세를 보이고 있습니다. 특히, 지지선 역할을 하는 저항선은 Dogecoin의 긍정적인 프로세스를 반영합니다.
The most important support levels to watch on the Dogecoin weekly chart are; $0.09202, $0.08643, and $0.07799, respectively. Especially, a weekly bar closing below the $0.08643 level, which intersects with the resistance line, could lead to selling pressure on the Dogecoin price.
Dogecoin 주간 차트에서 관찰해야 할 가장 중요한 지원 수준은 다음과 같습니다. 각각 $0.09202, $0.08643, $0.07799입니다. 특히, 저항선과 교차하는 $0.08643 수준 아래로 마감되는 주간 막대는 Dogecoin 가격에 매도 압력을 가할 수 있습니다.
The most important resistance levels to watch on the Dogecoin weekly chart are; $0.10550, $0.11815, and $0.13150, respectively. Especially, a weekly bar closing above the $0.10550 level, which has been a significant barrier for the last two weeks, will accelerate the momentum of the Dogecoin price.
Dogecoin 주간 차트에서 관찰해야 할 가장 중요한 저항 수준은 다음과 같습니다. 각각 $0.10550, $0.11815, $0.13150입니다. 특히, 지난 2주 동안 상당한 장벽이었던 $0.10550 수준을 넘는 주간 막대가 마감되면 Dogecoin 가격의 모멘텀이 가속화될 것입니다.

계속 읽기: https://en.coin-turk.com/dogecoin-technical-analytic-overview/


 Coin_Gabbar
 Coincu
 DogeHome
 BlockchainReporter
 CoinPedia News
 TheNewsCrypto
 CFN
CFN


