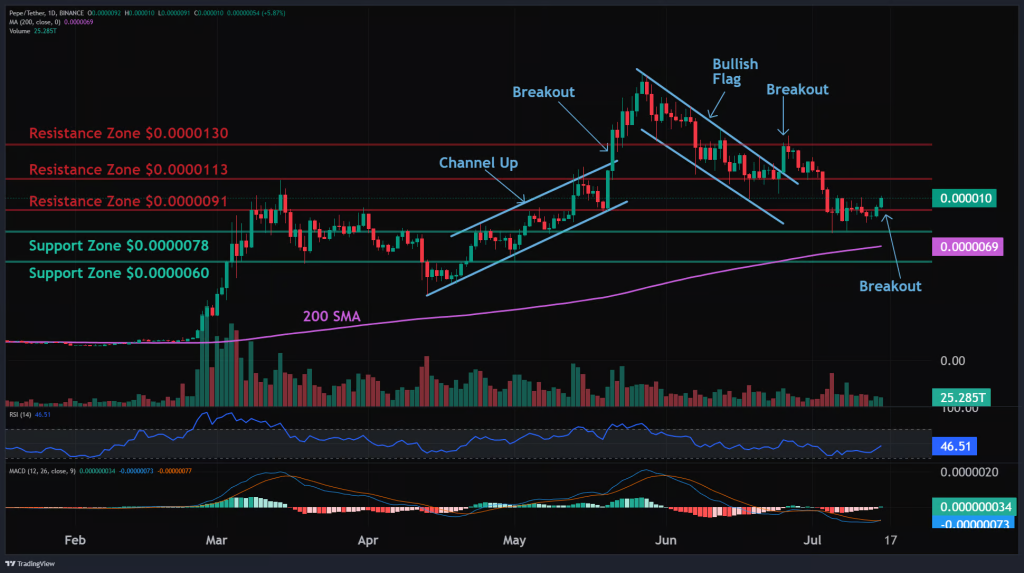
Following a record-breaking $7 billion market capitalization in May, PEPE's value plummeted by approximately 50% during a significant correction phase.
However, PEPE experienced a 10% surge today, boosting its market capitalization back above $4 billion. At the time of writing, it is trading around $0.0000096.
Given the imminent launch of ETH ETFs, this might be a positive indicator for the Ethereum ecosystem as a whole. PEPE, being the second-largest meme token on the network (behind SHIB), is a part of this ecosystem.
PEPE Price: Technical Analysis
PEPE's trends are currently mixed, according to altFINS's analysis.
However, trading above its 200-day moving average indicates that the price is still in a long-term uptrend. After rebounding from the $0.0000078 support level (following a market decline earlier this month), the price has broken back above the $0.0000091 resistance.
They now predict a possible upside of $0.0000113, with traders considering a stop loss at $0.0000083.

Momentum is seemingly turning bullish again, as the MACD Histogram is on the rise. The recent price action has created a resistance breakout pattern, suggesting that buyers have absorbed the supply from sellers at this level. This could potentially allow the price to continue its advance.
While the short-term and medium-term trends are currently bearish, the long-term trend remains decidedly positive. The price is neither overbought nor oversold when measured by RSI-14 levels.
For those monitoring support and resistance levels, the nearest support zone is at $0.0000078, followed by $0.000006. The closest resistance zone lies at $0.0000113. Traders and investors might want to watch these levels for potential entry or exit points


 ETHNews
 Coin Edition
 DogeHome
 Crypto Daily™
 BlockchainReporter
 Crypto Daily™
 Crypto Daily™
 crypto.news
 CoinPedia News


