Following a record-breaking $7 billion market capitalization in May, PEPE's value plummeted by approximately 50% during a significant correction phase.
5月に70億ドルという記録的な時価総額を記録した後、PEPEの価値は大幅な調整局面で約50%急落した。
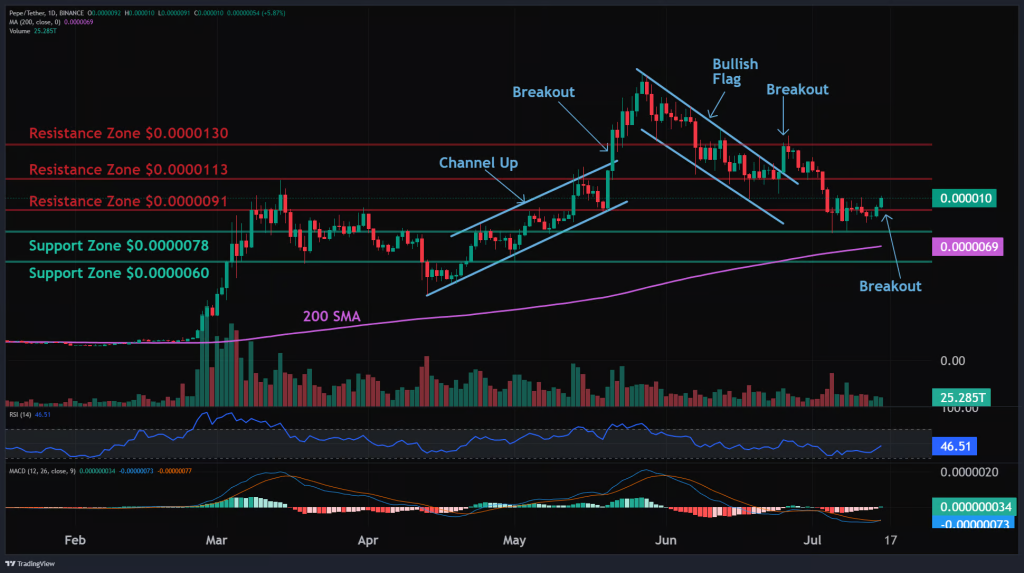
However, PEPE experienced a 10% surge today, boosting its market capitalization back above $4 billion. At the time of writing, it is trading around $0.0000096.
しかし、今日PEPEは10%の急騰を経験し、時価総額は40億ドルを超えました。この記事の執筆時点では、約0.0000096ドルで取引されています。
Given the imminent launch of ETH ETFs, this might be a positive indicator for the Ethereum ecosystem as a whole. PEPE, being the second-largest meme token on the network (behind SHIB), is a part of this ecosystem.
ETH ETF の開始が差し迫っていることを考えると、これはイーサリアムのエコシステム全体にとって前向きな指標となる可能性があります。 PEPE は、ネットワーク上で (SHIB に次ぐ) 2 番目に大きいミーム トークンであり、このエコシステムの一部です。
PEPE Price: Technical Analysis
PEPE価格:テクニカル分析
PEPE's trends are currently mixed, according to altFINS's analysis.
altFINS の分析によると、PEPE の傾向は現在まちまちです。
However, trading above its 200-day moving average indicates that the price is still in a long-term uptrend. After rebounding from the $0.0000078 support level (following a market decline earlier this month), the price has broken back above the $0.0000091 resistance.
しかし、200日移動平均を上回って取引されているということは、価格がまだ長期的な上昇傾向にあることを示しています。 (今月初めの市場下落を受けて)0.0000078ドルのサポートレベルから反発した後、価格は0.0000091ドルのレジスタンスを上抜けました。
They now predict a possible upside of $0.0000113, with traders considering a stop loss at $0.0000083.
彼らは現在、0.0000113ドルの上昇の可能性を予測しており、トレーダーは0.0000083ドルでストップロスを検討しています。

Momentum is seemingly turning bullish again, as the MACD Histogram is on the rise. The recent price action has created a resistance breakout pattern, suggesting that buyers have absorbed the supply from sellers at this level. This could potentially allow the price to continue its advance.
MACD ヒストグラムが上昇しているため、勢いは再び強気に転じているようです。最近の価格動向はレジスタンスブレイクアウトパターンを生み出しており、買い手がこのレベルで売り手からの供給を吸収したことを示唆しています。これにより、価格の上昇が続く可能性があります。
While the short-term and medium-term trends are currently bearish, the long-term trend remains decidedly positive. The price is neither overbought nor oversold when measured by RSI-14 levels.
短期および中期トレンドは現在弱気ですが、長期トレンドは依然として明らかにプラスです。 RSI-14レベルで測定すると、価格は買われすぎでも売られすぎでもありません。
For those monitoring support and resistance levels, the nearest support zone is at $0.0000078, followed by $0.000006. The closest resistance zone lies at $0.0000113. Traders and investors might want to watch these levels for potential entry or exit points
サポートとレジスタンスのレベルを監視している場合、最も近いサポート ゾーンは $0.0000078 で、次に $0.000006 です。最も近いレジスタンスゾーンは 0.0000113 ドルにあります。トレーダーや投資家は、潜在的なエントリーポイントまたはエグジットポイントを見つけるためにこれらのレベルを監視したいと思うかもしれません


 Crypto News Land
 TheNewsCrypto
 CFN
CFN Crypto Daily™
 Crypto Daily™
 Crypto Daily™
 CryptoPotato_News
 DogeHome
 Crypto Daily™


