Following a record-breaking $7 billion market capitalization in May, PEPE's value plummeted by approximately 50% during a significant correction phase.
지난 5월 기록적인 시가총액 70억 달러를 기록한 이후 PEPE의 가치는 상당한 조정 단계에서 약 50% 급락했습니다.
However, PEPE experienced a 10% surge today, boosting its market capitalization back above $4 billion. At the time of writing, it is trading around $0.0000096.
그러나 PEPE는 오늘 10% 급등을 경험하여 시가총액이 다시 40억 달러를 넘어섰습니다. 이 글을 쓰는 시점에는 $0.0000096 정도에 거래되고 있습니다.
Given the imminent launch of ETH ETFs, this might be a positive indicator for the Ethereum ecosystem as a whole. PEPE, being the second-largest meme token on the network (behind SHIB), is a part of this ecosystem.
ETH ETF 출시가 임박했다는 점을 고려하면 이는 이더리움 생태계 전체에 긍정적인 지표가 될 수 있습니다. 네트워크에서 SHIB에 이어 두 번째로 큰 밈 토큰인 PEPE는 이 생태계의 일부입니다.
PEPE Price: Technical Analysis
PEPE 가격 : 기술적 분석
PEPE's trends are currently mixed, according to altFINS's analysis.
altFINS의 분석에 따르면 PEPE의 추세는 현재 혼합되어 있습니다.
However, trading above its 200-day moving average indicates that the price is still in a long-term uptrend. After rebounding from the $0.0000078 support level (following a market decline earlier this month), the price has broken back above the $0.0000091 resistance.
그러나 200일 이동평균 이상으로 거래된다는 것은 가격이 여전히 장기적인 상승 추세에 있음을 나타냅니다. (이달 초 시장 하락에 이어) $0.0000078 지지선에서 반등한 후 가격은 $0.0000091 저항선을 넘어섰습니다.
They now predict a possible upside of $0.0000113, with traders considering a stop loss at $0.0000083.
그들은 이제 $0.0000113의 상승 여력을 예상하고 있으며 거래자들은 $0.0000083의 손실을 고려하고 있습니다.
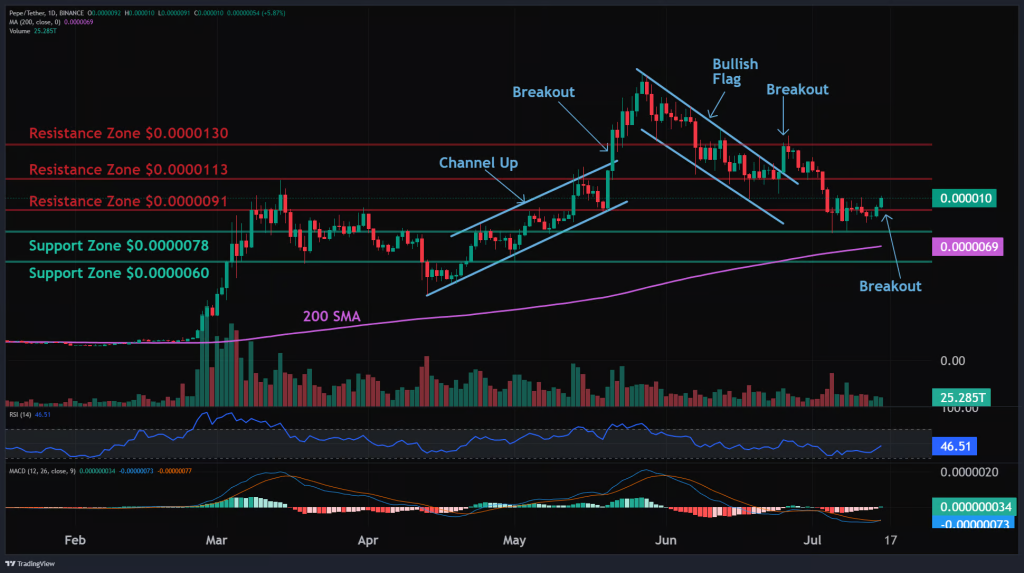
Momentum is seemingly turning bullish again, as the MACD Histogram is on the rise. The recent price action has created a resistance breakout pattern, suggesting that buyers have absorbed the supply from sellers at this level. This could potentially allow the price to continue its advance.
MACD 히스토그램이 상승세를 보이면서 모멘텀이 다시 강세를 보이고 있는 것 같습니다. 최근 가격 조치로 인해 저항 돌파 패턴이 형성되었으며, 이는 구매자가 이 수준에서 판매자의 공급을 흡수했음을 나타냅니다. 이로 인해 가격이 계속해서 상승할 가능성이 있습니다.
While the short-term and medium-term trends are currently bearish, the long-term trend remains decidedly positive. The price is neither overbought nor oversold when measured by RSI-14 levels.
현재 단기 및 중기 추세는 약세지만, 장기 추세는 확실히 긍정적입니다. RSI-14 수준으로 측정할 때 가격은 과매수도 과매도도 아닙니다.
For those monitoring support and resistance levels, the nearest support zone is at $0.0000078, followed by $0.000006. The closest resistance zone lies at $0.0000113. Traders and investors might want to watch these levels for potential entry or exit points
지원 및 저항 수준을 모니터링하는 경우 가장 가까운 지원 영역은 $0.0000078이고 그 다음은 $0.000006입니다. 가장 가까운 저항 영역은 $0.0000113입니다. 트레이더와 투자자는 잠재적인 진입점이나 청산점을 알아보기 위해 이러한 수준을 관찰하고 싶어할 수 있습니다.


 Crypto News Land
 TheNewsCrypto
 CFN
CFN Crypto Daily™
 Crypto Daily™
 Crypto Daily™
 CryptoPotato_News
 DogeHome
 Crypto Daily™


