

Bitcoin (BTC) rebounded from its intraday low on March 7th and is attempting to break above the $90,000 resistance level, suggesting buying pressure at lower prices. This followed a sell-off after the US Strategic Bitcoin Reserve executive order, signed by President Trump, fell short of market expectations.
However, some analysts view the reserve's creation as bullish, anticipating other nations will follow suit. This development also alleviates concerns some institutional investors have about Bitcoin investment. Swan Bitcoin CEO Cory Klippsten told Cointelegraph that Bitcoin is in a consolidation phase, but this isn't necessarily the end of the bull run. He predicts a new all-time high above $109,000 before June.
Not all analysts share this optimistic short-term outlook. Bitfinex analysts stated to Cointelegraph that Bitcoin is likely to remain range-bound due to the lack of further US purchases. Nevertheless, they consider the reserve a positive step, describing it as a softer approach likely to encounter less resistance and provide a good starting point for experimenting with Bitcoin as a reserve asset.
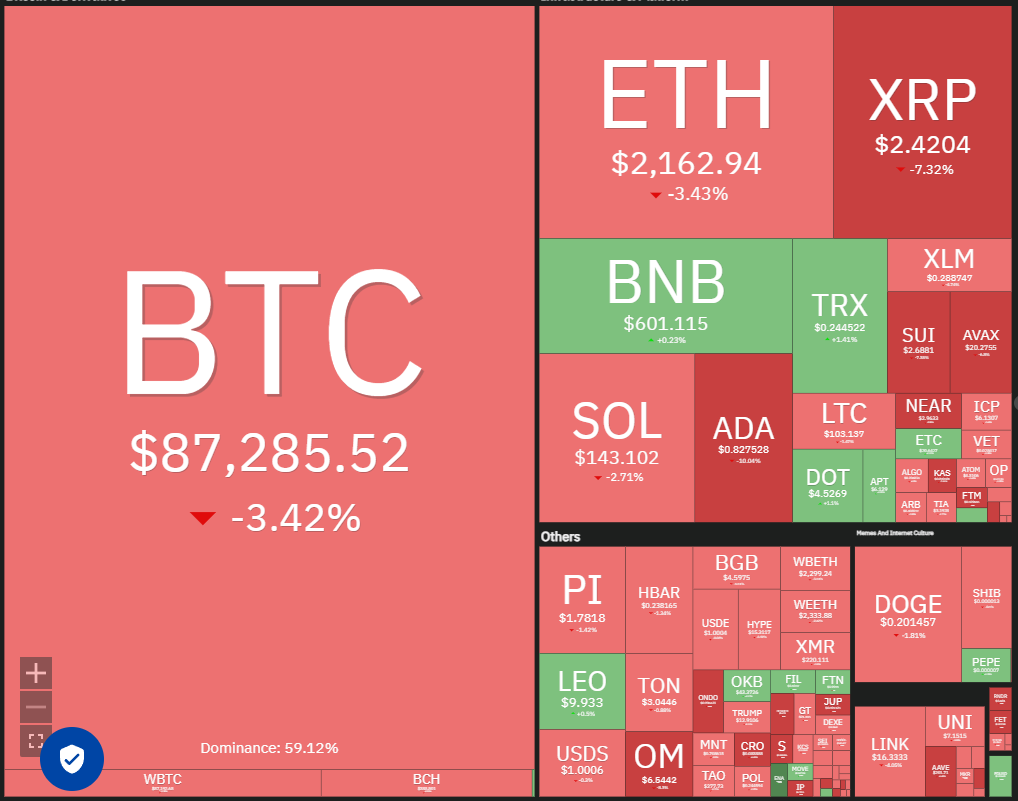
Could Bitcoin sustain a price above $90,000, and would this lift altcoins? Let's examine the charts of the top 10 cryptocurrencies.
Bitcoin Price Analysis
Bitcoin rebounded from the $85,000 level on March 7th, suggesting bulls are attempting to establish a higher low.
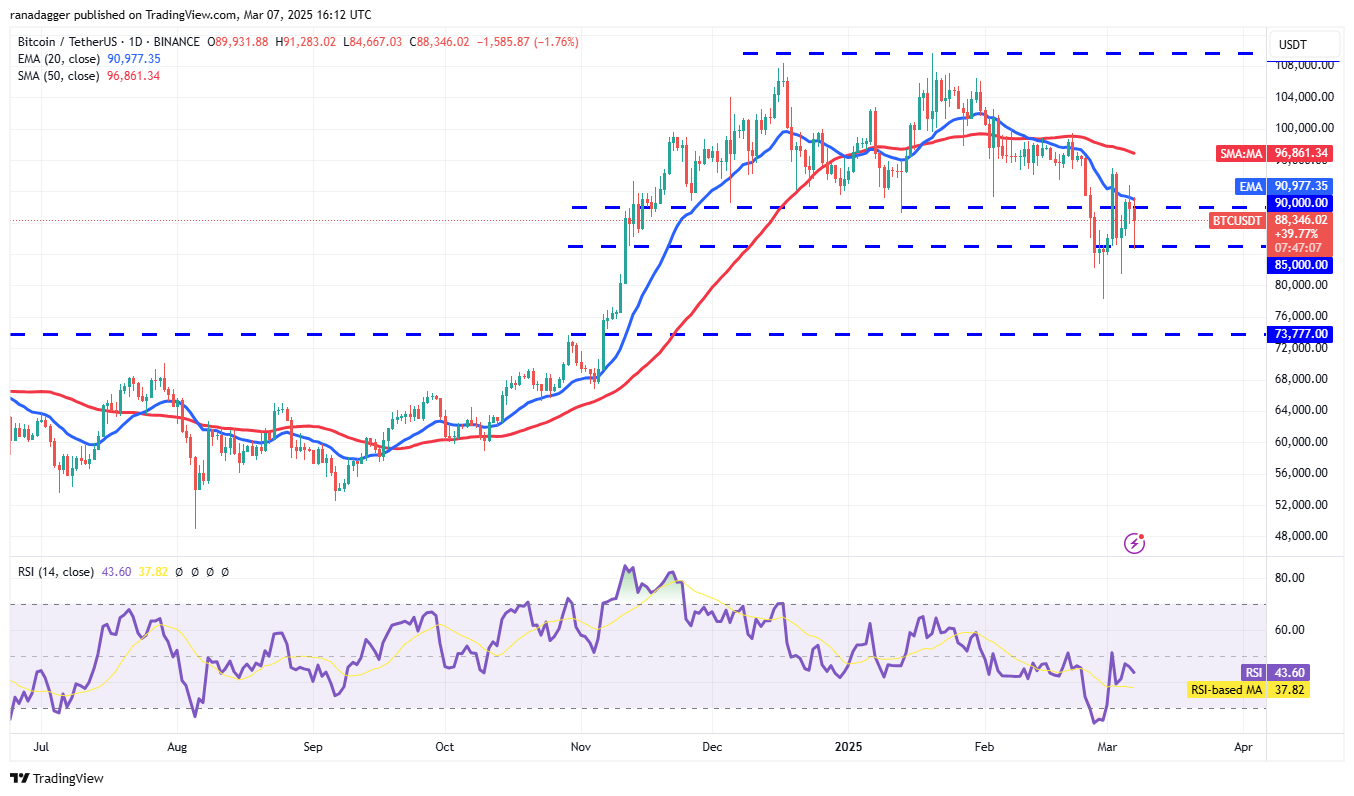
A decisive close above the 20-day exponential moving average ($90,977) would signal a bullish resurgence. The BTC/USDT pair could then rise to the 50-day simple moving average ($96,861). Resistance is anticipated between the 50-day SMA and $100,000; however, a bullish breakout could propel the pair towards $109,588.
Conversely, a sustained break below $85,000 would favor bears, potentially leading to a decline to $78,258 and further to $73,777.
Ether Price Analysis
Ether (ETH) dipped to the $2,111 support on March 7th, demonstrating continued bear pressure. However, the long lower wick on the candlestick suggests bullish defense of this level.
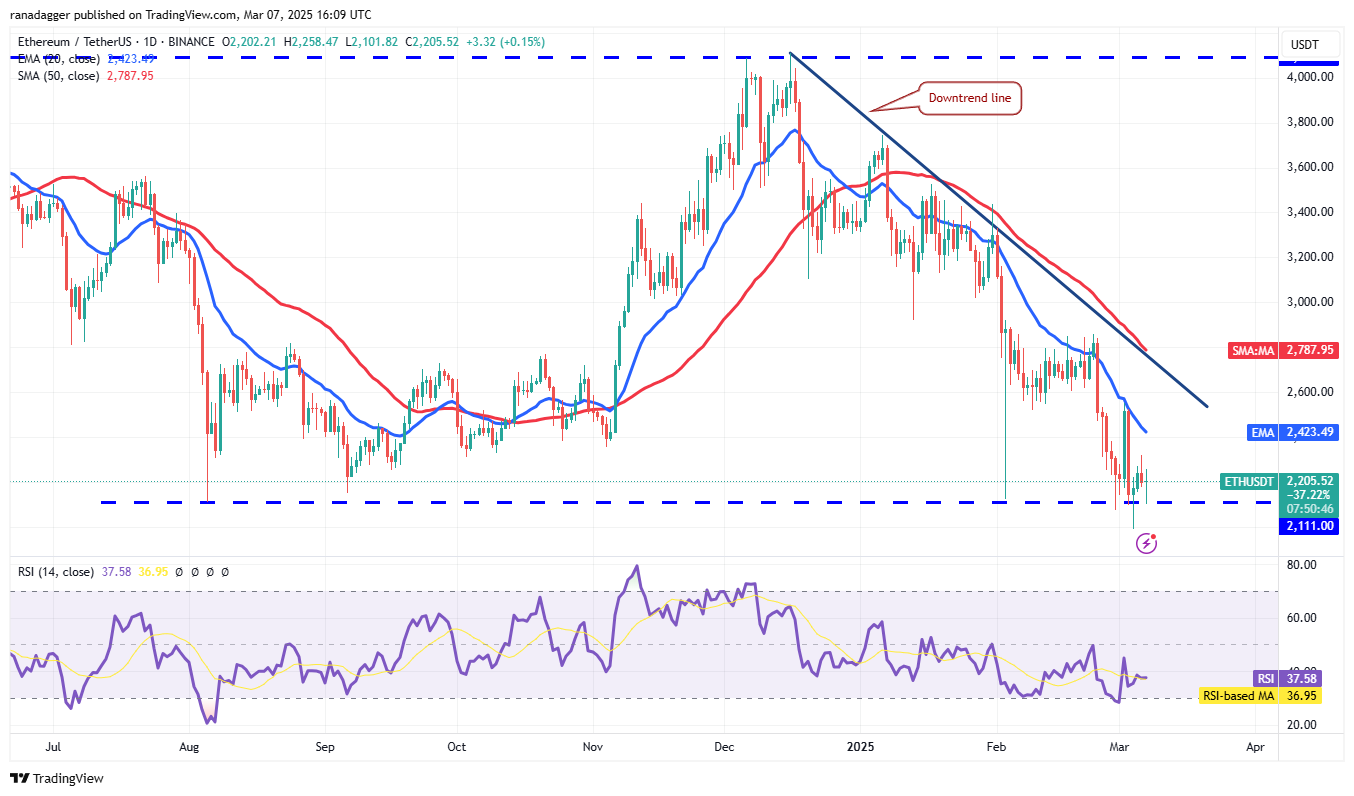
Bulls will aim to push the price towards the 20-day EMA ($2,423), a key short-term indicator. A close above this EMA would signal weakening bear dominance. A break above the downtrend line would confirm a bullish reversal.
Conversely, a reversal from the current level or a break below $2,111 would suggest a continuation of the downtrend, potentially leading to a drop to $1,750.
XRP Price Analysis
XRP (XRP) closed above the 20-day EMA ($2.49) on March 6th, but failed to overcome the 50-day SMA ($2.68).
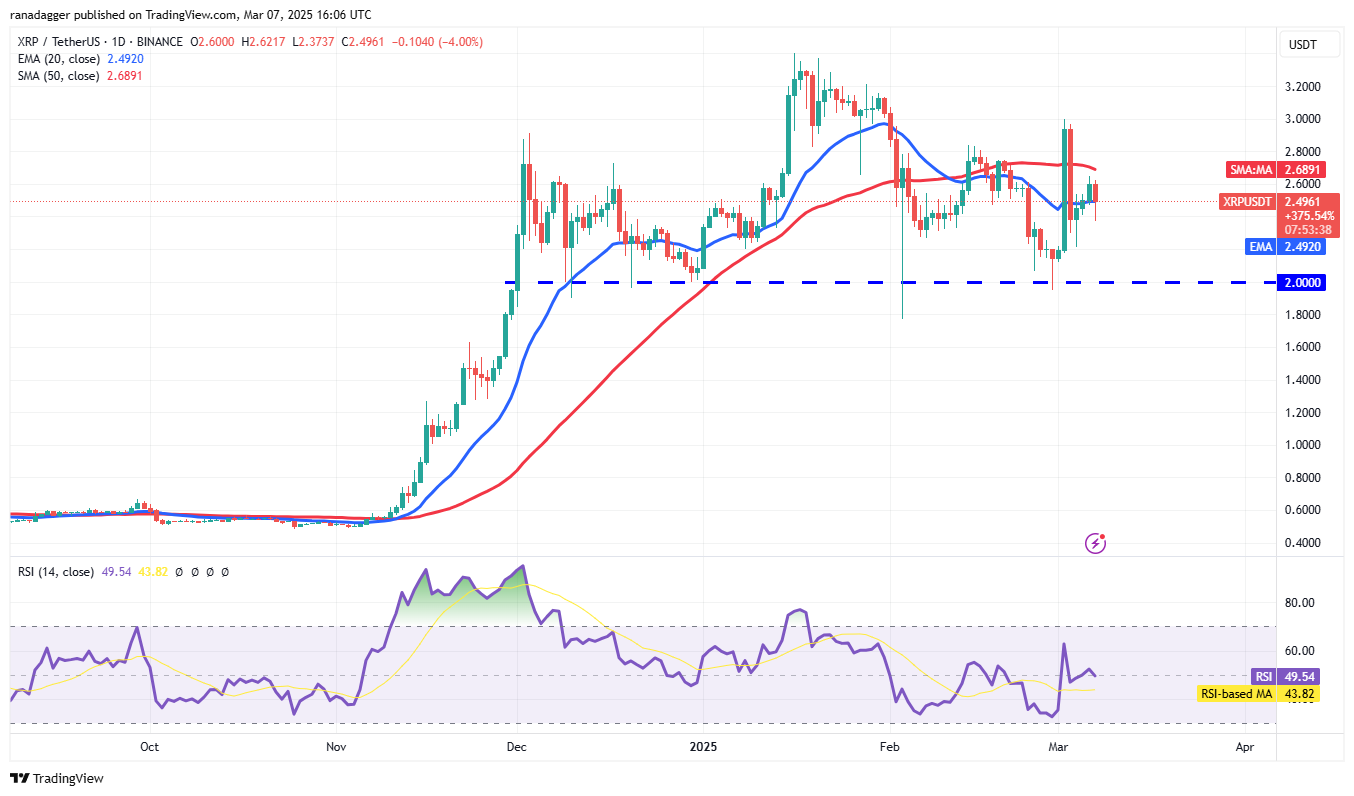
The relatively flat 20-day EMA and RSI near the midpoint suggest short-term range-bound trading. A break below the 20-day EMA could lead to a decline to $2.20, a level expected to see strong buying support. A bounce from this zone could establish a trading range between $2.20 and $3.
A break above $3 could trigger a move towards $3.40, with significant resistance anticipated at that level. A successful breakout above $3.40 could lead to a surge towards $5.
BNB Price Analysis
BNB (BNB) reversed from the 20-day EMA ($616) on March 6th, but bulls held their ground relatively well.
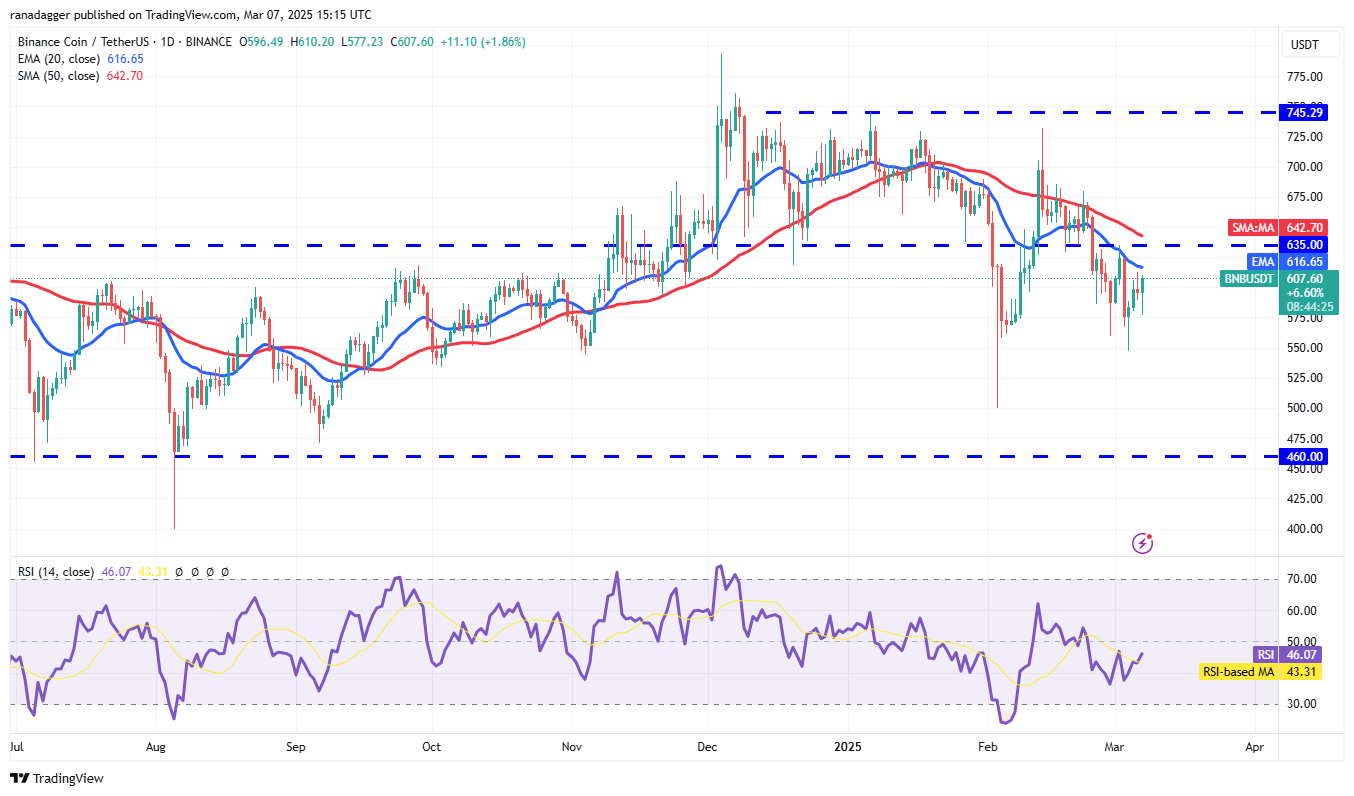
This increases the probability of a break above the 20-day EMA. Any subsequent rally is expected to face resistance at the 50-day SMA ($642), but a breakout could lead to a rise to $686.
A break below the $546 support level would invalidate this bullish outlook, potentially leading to a decline to $500, where buying support is likely.
Solana Price Analysis
Solana (SOL) has found support at the uptrend line, indicating a potential recovery attempt.
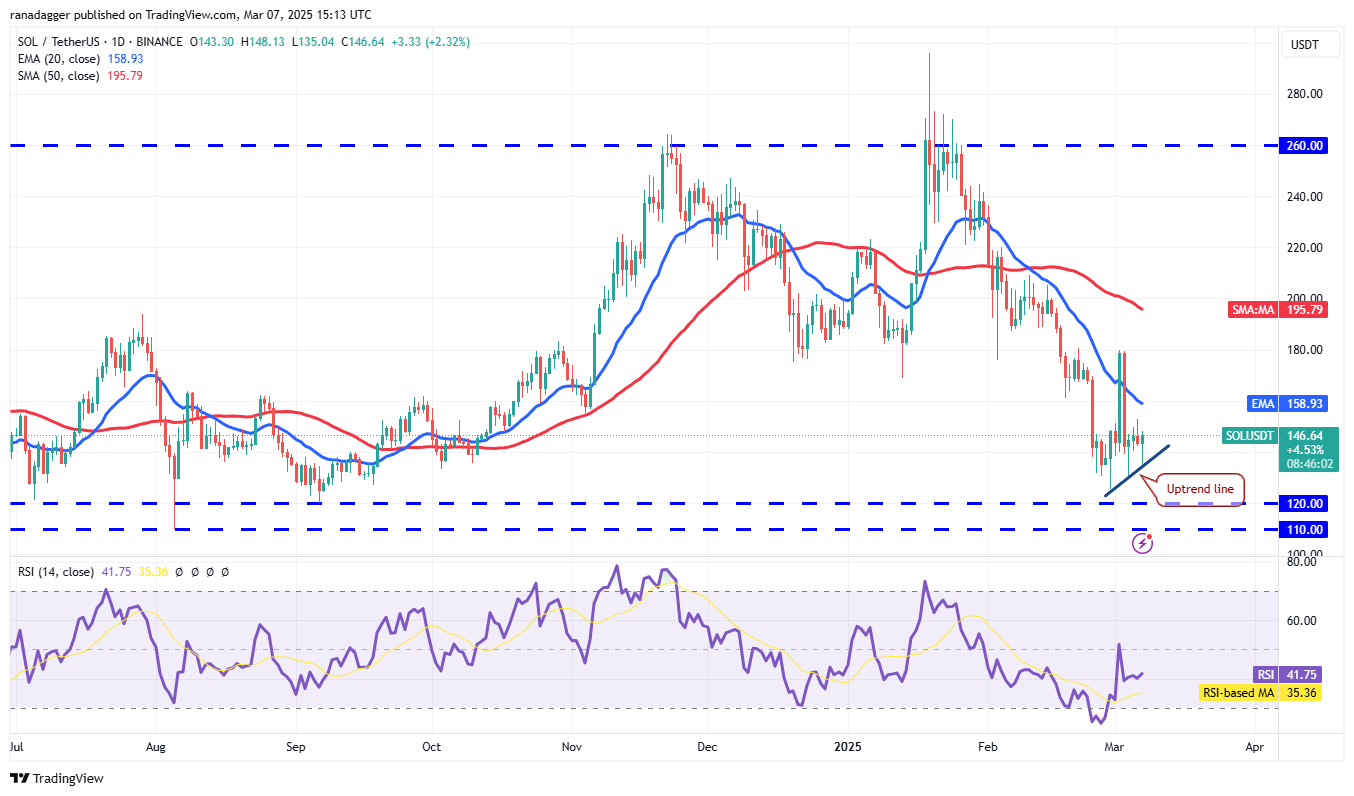
The 20-day EMA ($158) represents key overhead resistance. A break above this level could send the SOL/USDT pair to $180, with further resistance anticipated at this level. A successful breakout above $180 could signal the end of the correction, potentially leading to a rise to $220.
Conversely, a break below the uptrend line would suggest continued bear pressure, potentially leading to a decline to $120 and then to $110.
Cardano Price Analysis
Cardano (ADA) reversed from $1.02 on March 5th and reached the 20-day EMA ($0.82) on March 7th.
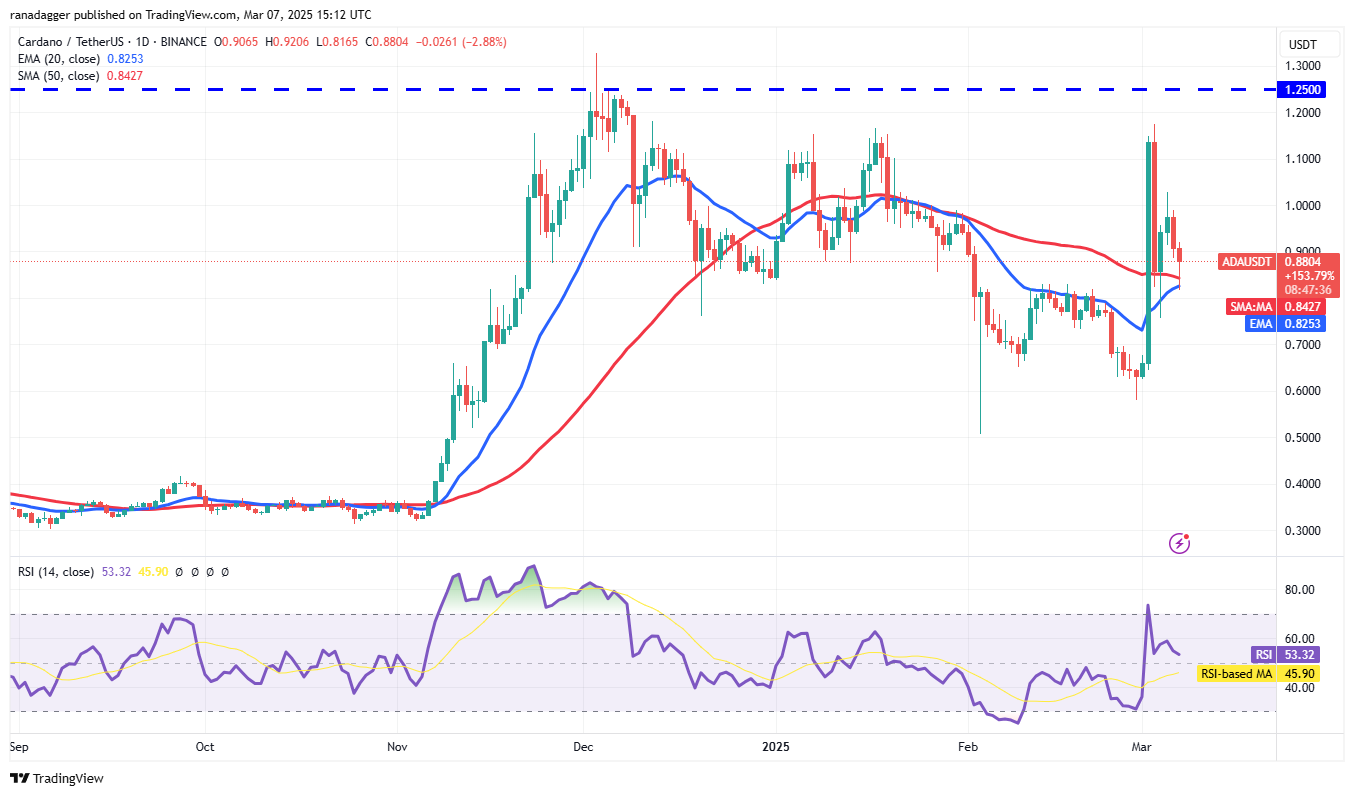
A strong rebound from the 20-day EMA could allow bulls to push the ADA/USDT pair back above $1.02, potentially leading to a rally towards the $1.25 resistance level.
Conversely, a reversal from $1.02 would indicate continued bear pressure, potentially establishing a trading range between $1.02 and $0.75. A break below $0.75 could lead to a decline to $0.60.
Dogecoin Price Analysis
Buyers attempted a Dogecoin (DOGE) recovery on March 6th but faced selling pressure at the 20-day EMA ($0.22).
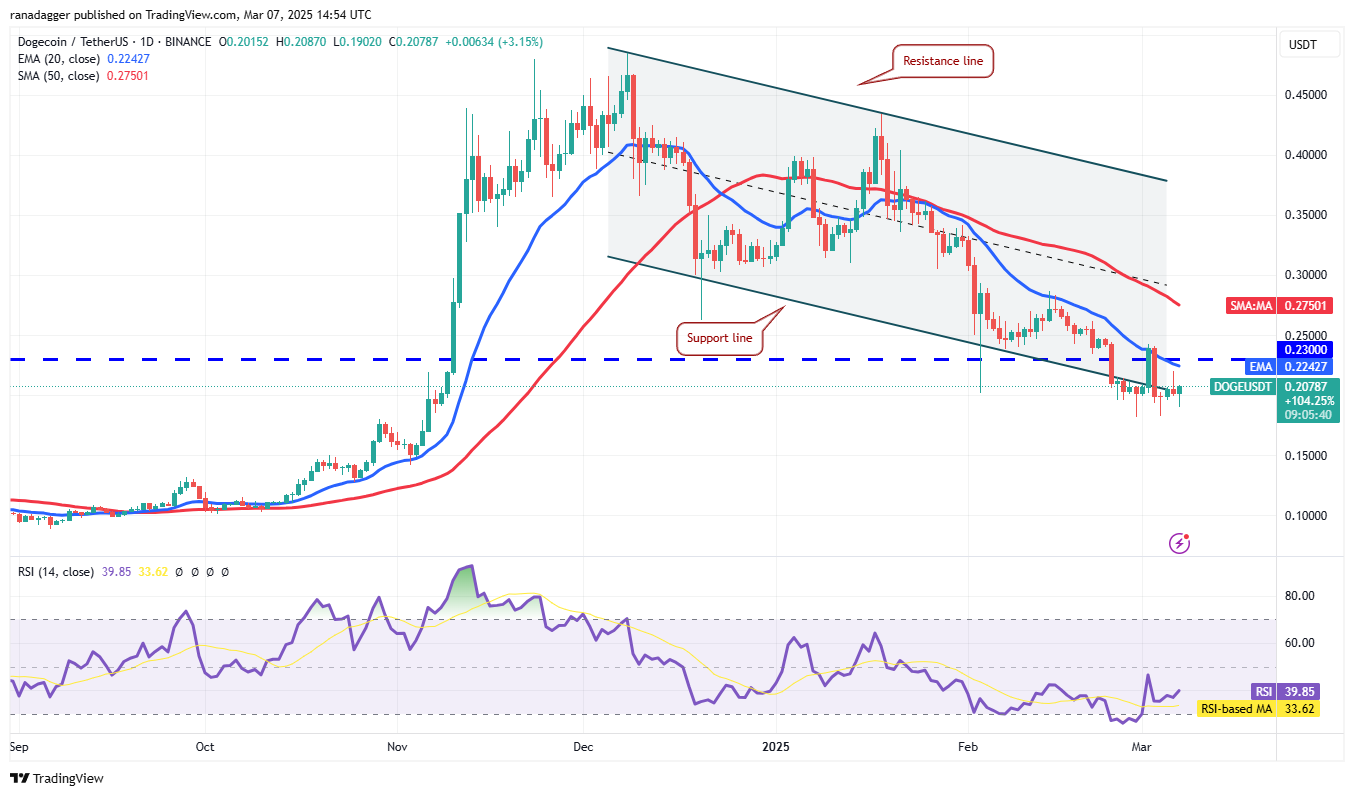
A break below $0.18 would signal the start of a new downtrend, potentially leading to a decline to $0.14 and then to $0.10, where buying support is expected.
Conversely, a break above the 20-day EMA would invalidate this bearish outlook, potentially leading to a rise to the 50-day SMA ($0.27). The pair may then consolidate within the descending channel.
Pi Price Analysis
Buyers failed to sustain Pi (PI) above $2 on March 5th, indicating weak demand at higher levels.
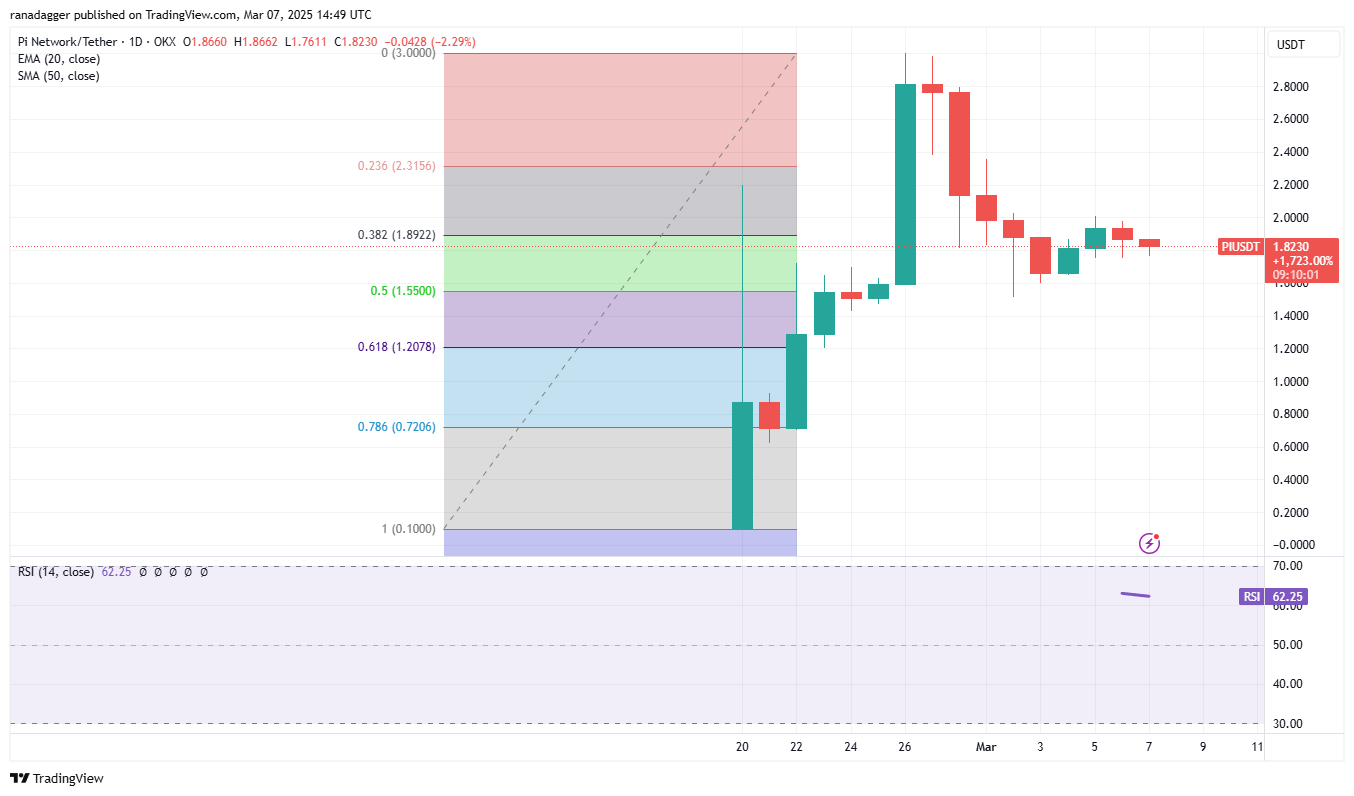
Bears will aim to push the price down to $1.60 and then to $1.51. A rebound from $1.51 could establish a short-term trading range between $1.51 and $2.
A break above $2 would signal a bullish reversal, potentially leading to a rise to $2.35 and then to $2.80. A break below $1.51 could lead to a decline to the 61.8% Fibonacci retracement level of $1.20.
Hedera Price Analysis
Hedera (HBAR) has traded between moving averages, suggesting potential for increased range expansion.
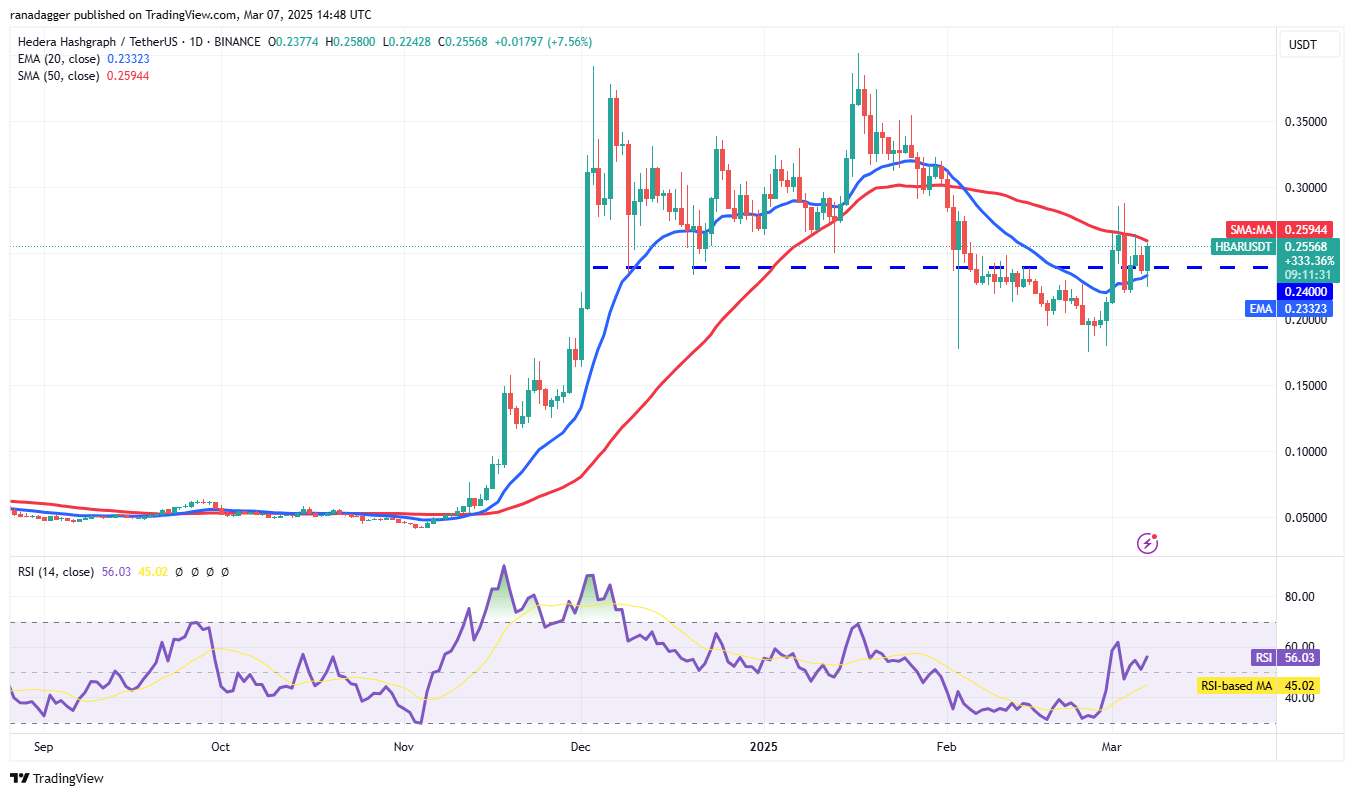
A break above the 50-day SMA ($0.26) could propel the HBAR/USDT pair to $0.29, a key resistance level. A successful breakout could signal the end of the correction and lead to a rise to $0.35.
Conversely, a close below $0.22 would indicate bear dominance, potentially leading to a decline to $0.17, where buying support is anticipated.
Chainlink Price Analysis
Chainlink (LINK) closed above the 20-day EMA ($16.81) on March 6th, showing buying pressure at lower levels.
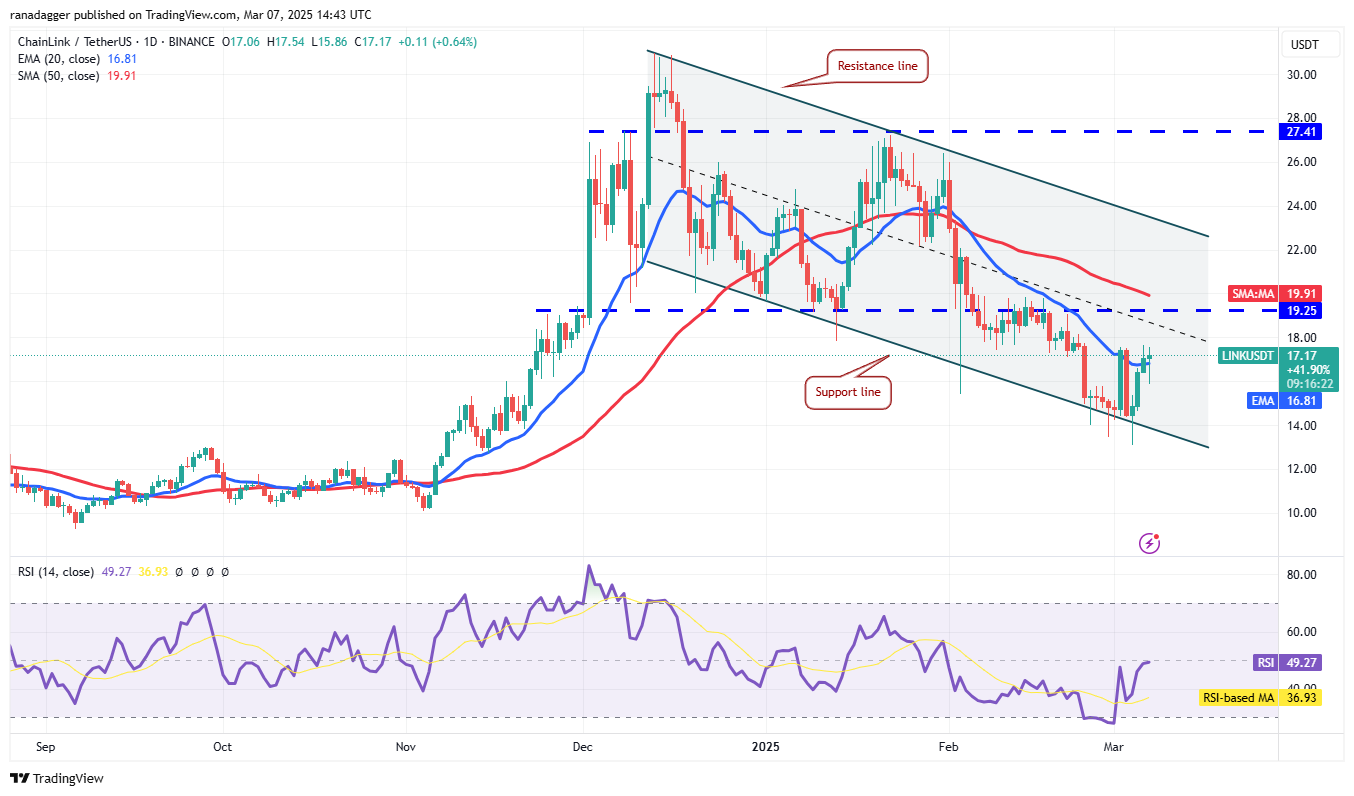
Minor resistance exists at $18. A breakout could lead to a rise to the 50-day SMA ($19.91), potentially extending the range-bound trading within the channel. A sustained break above the resistance line would confirm a trend change.
A break below $13 would favor bears, potentially leading to a decline to $10.
Disclaimer: This article does not provide investment advice. All investment decisions involve risk, and readers should conduct thorough research before making any investment.
 Bitcoin Sistemi EN
 U_Today
 U_Today
 Crypto Daily™
 crypto.news
 BlockchainReporter
 DogeHome
 Crypto Front News
 BlockchainReporter


