

Bitcoin (BTC) rebounded from its intraday low on March 7th and is attempting to break above the $90,000 resistance level, suggesting buying pressure at lower prices. This followed a sell-off after the US Strategic Bitcoin Reserve executive order, signed by President Trump, fell short of market expectations.
比特币(BTC)从3月7日的盘中低点反弹,并试图超过90,000美元的电阻水平,这表明以较低的价格购买压力。 这是在特朗普总统签署的美国战略比特币储备金行政命令之后的抛售之后,没有市场期望。
However, some analysts view the reserve's creation as bullish, anticipating other nations will follow suit. This development also alleviates concerns some institutional investors have about Bitcoin investment. Swan Bitcoin CEO Cory Klippsten told Cointelegraph that Bitcoin is in a consolidation phase, but this isn't necessarily the end of the bull run. He predicts a new all-time high above $109,000 before June.
但是,一些分析师将保护区的创造视为看涨,预计其他国家将效仿。 这一发展还减轻了一些机构投资者对比特币投资的涉及。 天鹅比特币首席执行官Cory Klippsten告诉Cointelegraph,比特币处于合并阶段,但这不一定是公牛跑步的终结。 他预计6月之前将有一个新的历史最高高于109,000美元的高度。
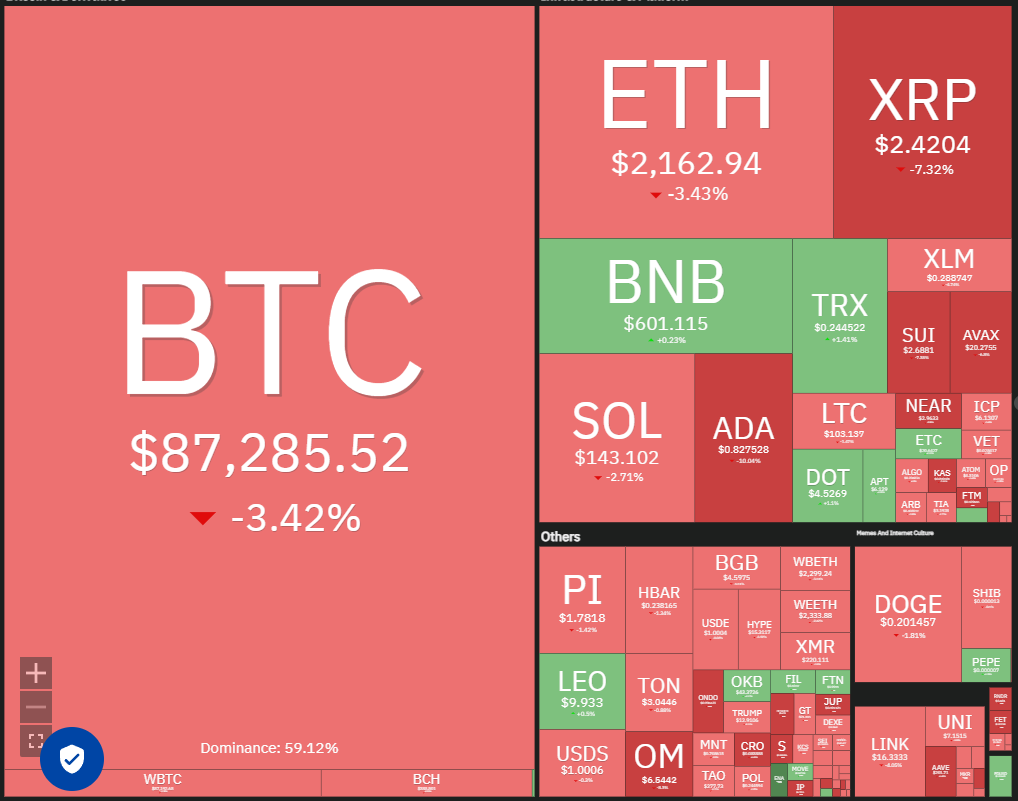
Not all analysts share this optimistic short-term outlook. Bitfinex analysts stated to Cointelegraph that Bitcoin is likely to remain range-bound due to the lack of further US purchases. Nevertheless, they consider the reserve a positive step, describing it as a softer approach likely to encounter less resistance and provide a good starting point for experimenting with Bitcoin as a reserve asset.
并非所有分析师都分享这种乐观的短期前景。 Bitfinex分析师指出,Cointelegraph表示,由于缺乏进一步的美国购买,比特币可能会保持范围限制。 然而,他们认为储备是积极的一步,将其描述为一种较软的方法,可能会遇到较少的阻力,并为实验比特币作为储备资产提供了一个良好的起点。
Could Bitcoin sustain a price above $90,000, and would this lift altcoins? Let's examine the charts of the top 10 cryptocurrencies.
比特币能否维持超过90,000美元的价格,这可以举起山寨币吗?让我们检查前10个加密货币的图表。
Bitcoin Price Analysis
比特币价格分析
Bitcoin rebounded from the $85,000 level on March 7th, suggesting bulls are attempting to establish a higher low.
比特币从3月7日的85,000美元水平反弹,表明公牛试图建立更高的低点。
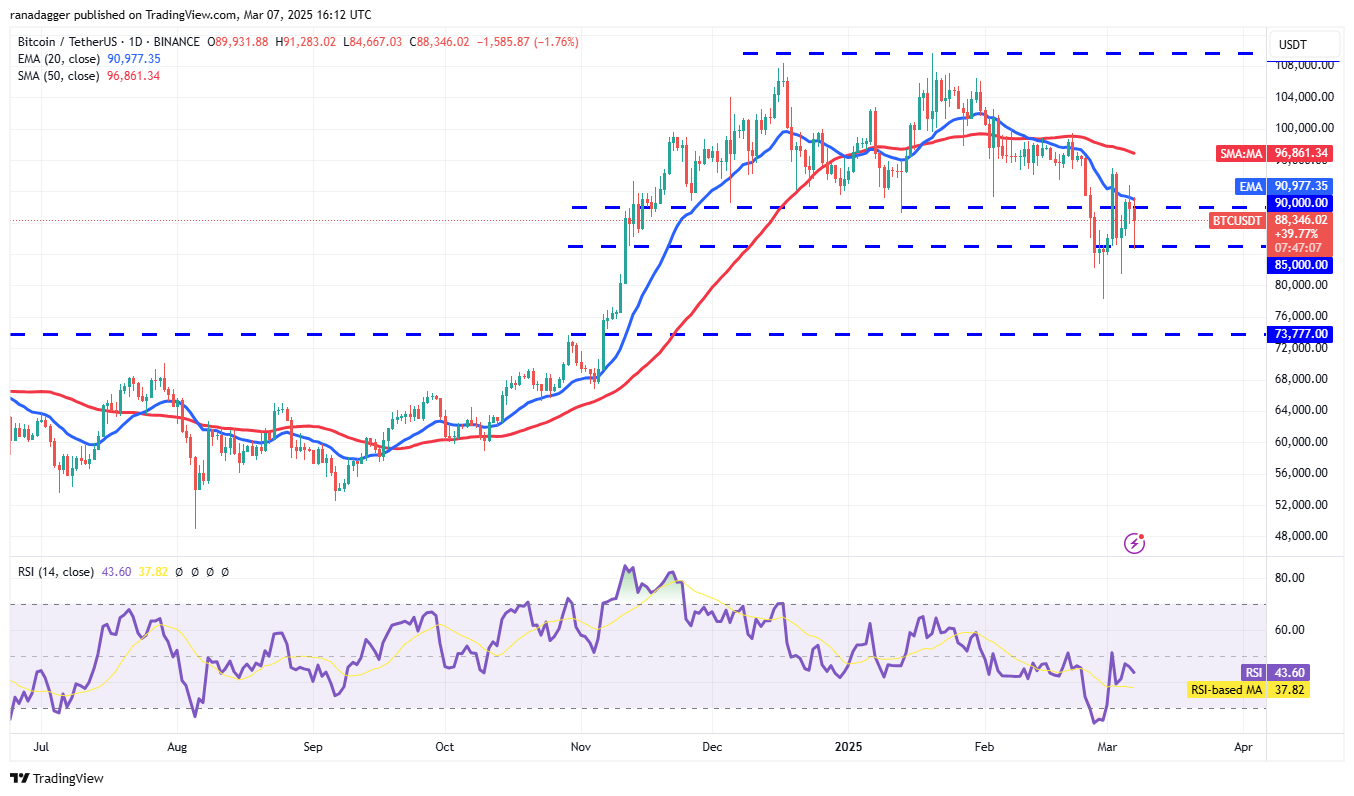
A decisive close above the 20-day exponential moving average ($90,977) would signal a bullish resurgence. The BTC/USDT pair could then rise to the 50-day simple moving average ($96,861). Resistance is anticipated between the 50-day SMA and $100,000; however, a bullish breakout could propel the pair towards $109,588.
超过20天的指数移动平均线(90,977美元)的决定性结束将表示看涨的复兴。 然后,BTC/USDT对可以上升到50天的简单移动平均线(96,861美元)。 预计在50天的SMA到100,000美元之间将有抵抗力;但是,看涨的突破可能会推动这对夫妇的$ 109,588。
Conversely, a sustained break below $85,000 would favor bears, potentially leading to a decline to $78,258 and further to $73,777.
相反,持续的休息时间低于$ 85,000将有利于熊,可能导致下降到78,258美元,进一步降至73,777美元。
Ether Price Analysis
以太价格分析
Ether (ETH) dipped to the $2,111 support on March 7th, demonstrating continued bear pressure. However, the long lower wick on the candlestick suggests bullish defense of this level.
Ether(ETH)在3月7日下降到2,111美元的支持,表明持续的熊压力。 但是,烛台上长期的较低的灯芯表明对这一水平的辩护。
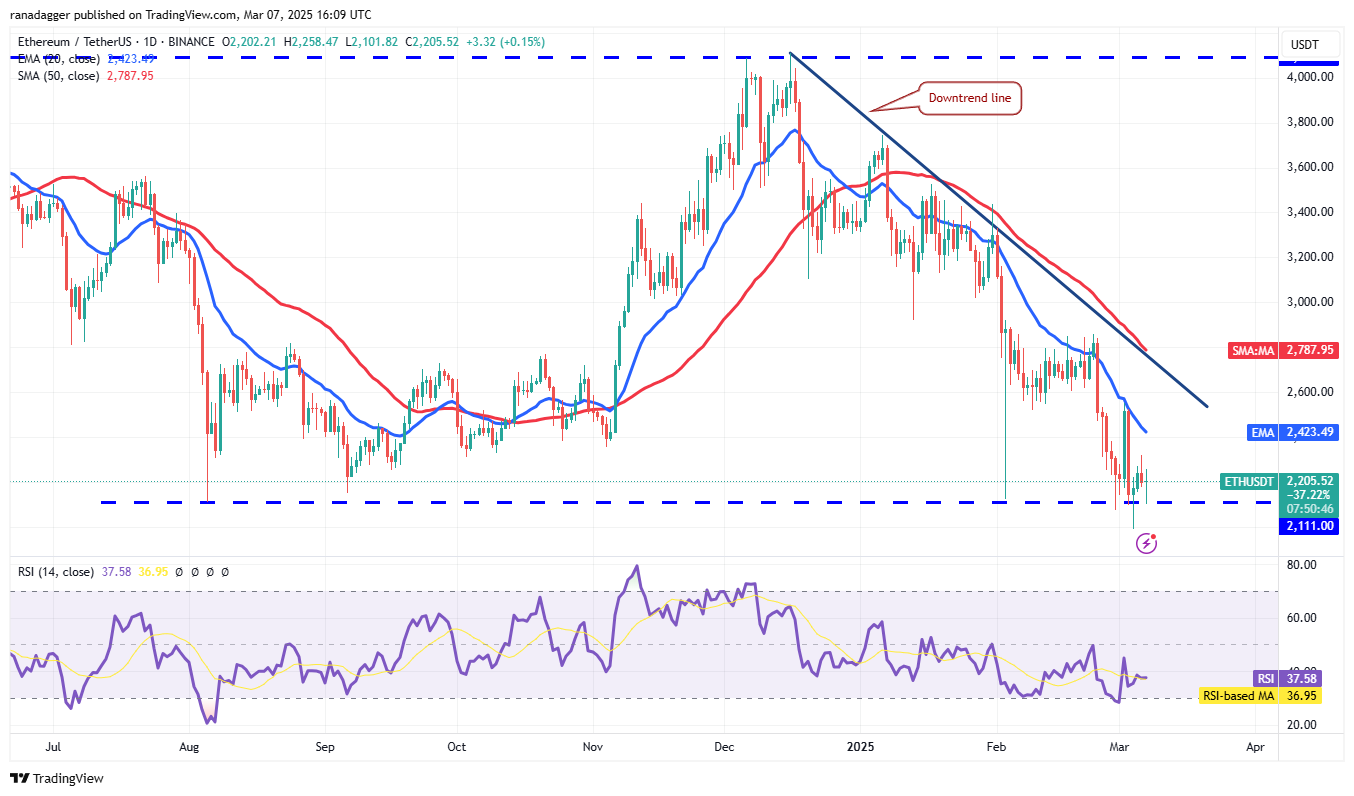
Bulls will aim to push the price towards the 20-day EMA ($2,423), a key short-term indicator. A close above this EMA would signal weakening bear dominance. A break above the downtrend line would confirm a bullish reversal.
公牛队的目标是将价格推向20天的EMA(2,423美元),这是一个主要的短期指标。 在此EMA上方的接近将表明弱熊的优势。 高于下降线的突破将证实看涨的逆转。
Conversely, a reversal from the current level or a break below $2,111 would suggest a continuation of the downtrend, potentially leading to a drop to $1,750.
相反,从当前水平或低于2,111美元的中断的逆转将表明下降趋势的延续,可能导致下降至1,750美元。
XRP Price Analysis
XRP价格分析
XRP (XRP) closed above the 20-day EMA ($2.49) on March 6th, but failed to overcome the 50-day SMA ($2.68).
XRP(XRP)于3月6日在20天EMA($ 2.49)上面关闭,但未能克服50天的SMA(2.68美元)。
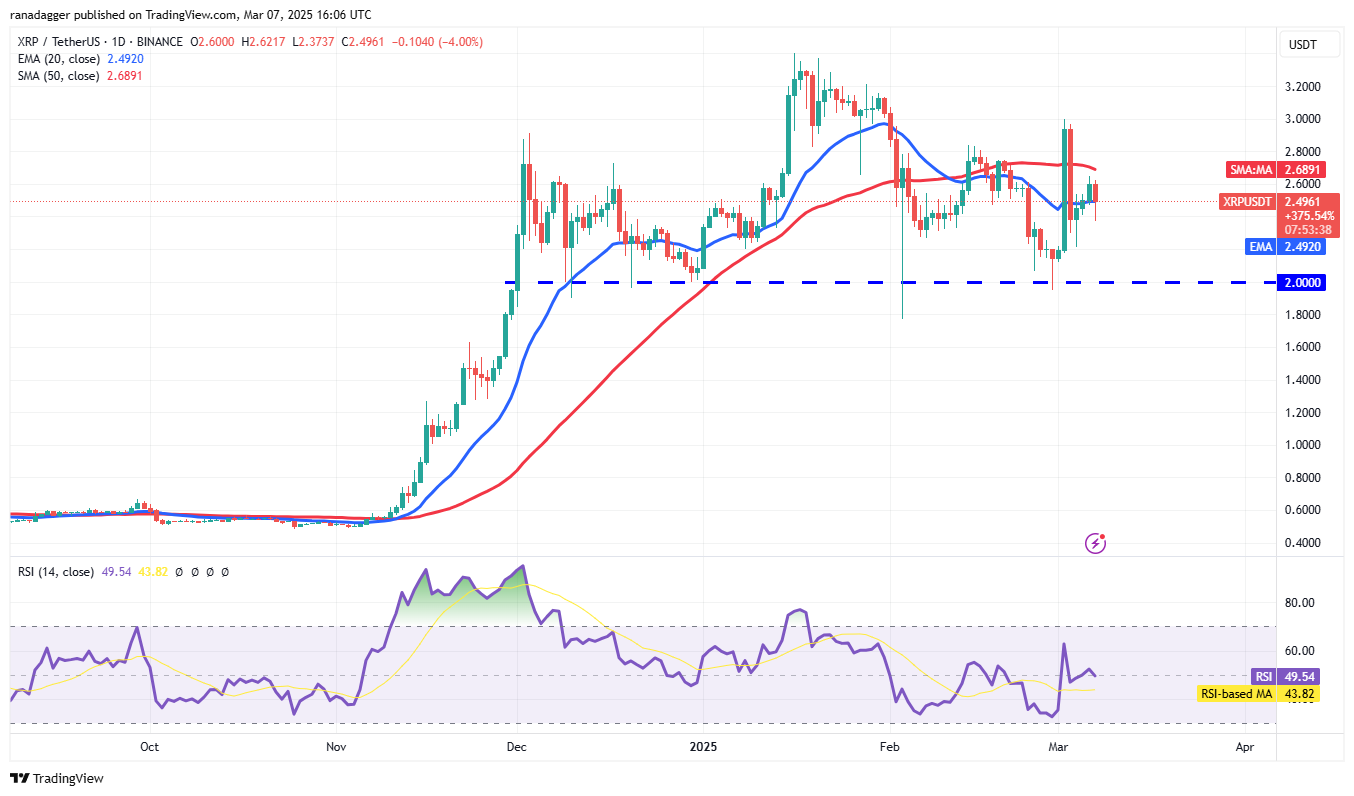
The relatively flat 20-day EMA and RSI near the midpoint suggest short-term range-bound trading. A break below the 20-day EMA could lead to a decline to $2.20, a level expected to see strong buying support. A bounce from this zone could establish a trading range between $2.20 and $3.
中点附近的相对较平坦的20天EMA和RSI表明短期范围内交易。 低于20天EMA的休息可能会导致下降至2.20美元,这一水平预计会看到强大的购买支持。 该区域的反弹可能建立2.20至3美元之间的交易范围。
A break above $3 could trigger a move towards $3.40, with significant resistance anticipated at that level. A successful breakout above $3.40 could lead to a surge towards $5.
超过$ 3的休息可能会触发3.40美元的转变,预计在该水平上会有明显的阻力。 超过$ 3.40的成功突破可能会导致5美元的增长。
BNB Price Analysis
BNB价格分析
BNB (BNB) reversed from the 20-day EMA ($616) on March 6th, but bulls held their ground relatively well.
BNB(BNB)于3月6日从20天的EMA(616美元)扭转,但公牛队的地面相对较好。
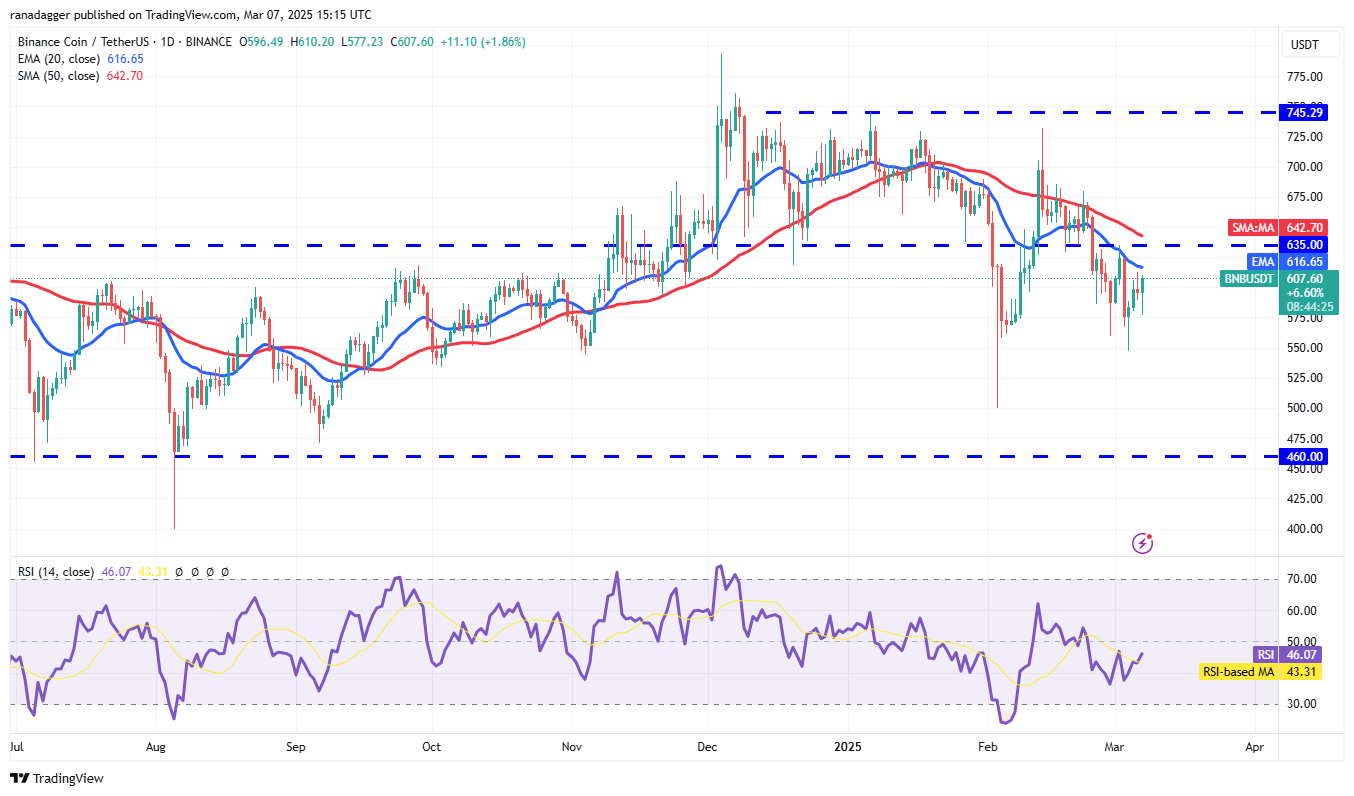
This increases the probability of a break above the 20-day EMA. Any subsequent rally is expected to face resistance at the 50-day SMA ($642), but a breakout could lead to a rise to $686.
这增加了突破超过20天EMA的概率。 随后的任何集会预计将在50天的SMA(642美元)上面对阻力,但突破可能会导致686美元上涨。
A break below the $546 support level would invalidate this bullish outlook, potentially leading to a decline to $500, where buying support is likely.
低于$ 546的支持水平的休息时间将使这种看涨的前景无效,这可能导致可能下降到500美元,而购买支持可能会下降。
Solana Price Analysis
Solana价格分析
Solana (SOL) has found support at the uptrend line, indicating a potential recovery attempt.
Solana(Sol)在上升线上找到了支持,表明潜在的恢复尝试。
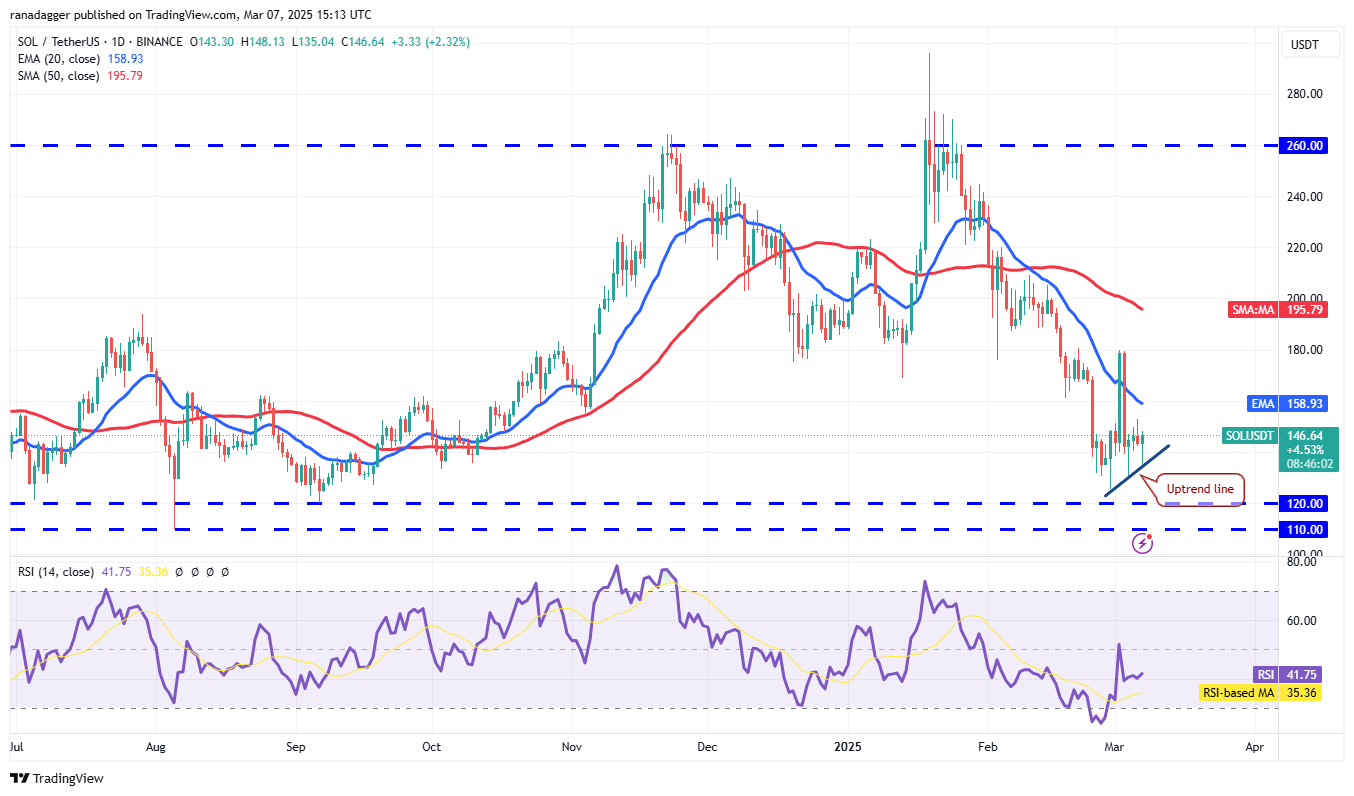
The 20-day EMA ($158) represents key overhead resistance. A break above this level could send the SOL/USDT pair to $180, with further resistance anticipated at this level. A successful breakout above $180 could signal the end of the correction, potentially leading to a rise to $220.
20天的EMA($ 158)代表关键的高架阻力。 超过此水平的休息可能会使SOL/USDT对达到180美元,并在此级别上预计会有进一步的阻力。 超过180美元以上的成功突破可能标志着更正的结束,可能会导致220美元上涨。
Conversely, a break below the uptrend line would suggest continued bear pressure, potentially leading to a decline to $120 and then to $110.
相反,在上升趋势线以下的休息时间将表明持续的熊压力,可能导致下降到120美元,然后下降至110美元。
Cardano Price Analysis
Cardano价格分析
Cardano (ADA) reversed from $1.02 on March 5th and reached the 20-day EMA ($0.82) on March 7th.
Cardano(ADA)从3月5日的$ 1.02扭转,并于3月7日到达20天EMA(0.82美元)。
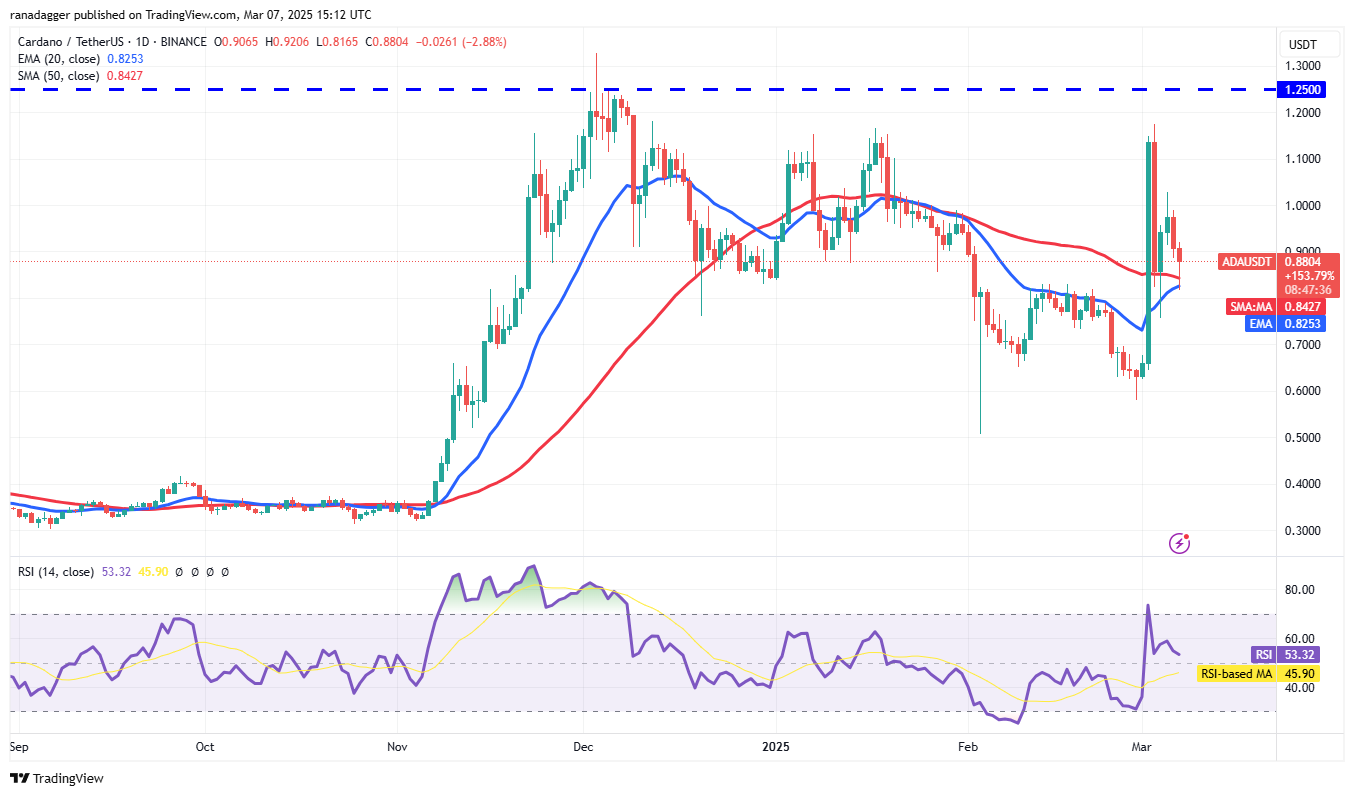
A strong rebound from the 20-day EMA could allow bulls to push the ADA/USDT pair back above $1.02, potentially leading to a rally towards the $1.25 resistance level.
从20天的EMA进行的强劲反弹可以使公牛队将ADA/USDT对推回1.02美元以上,这可能会导致涨到1.25美元的阻力水平。
Conversely, a reversal from $1.02 would indicate continued bear pressure, potentially establishing a trading range between $1.02 and $0.75. A break below $0.75 could lead to a decline to $0.60.
相反,从$ 1.02的逆转将表明持续的熊压力,可能建立1.02美元至0.75美元的交易范围。 低于$ 0.75的休息可能会导致下降到0.60美元。
Dogecoin Price Analysis
Dogecoin价格分析
Buyers attempted a Dogecoin (DOGE) recovery on March 6th but faced selling pressure at the 20-day EMA ($0.22).
买家在3月6日尝试了Dogecoin(Doge)的恢复,但在20天EMA(0.22美元)面临销售压力。
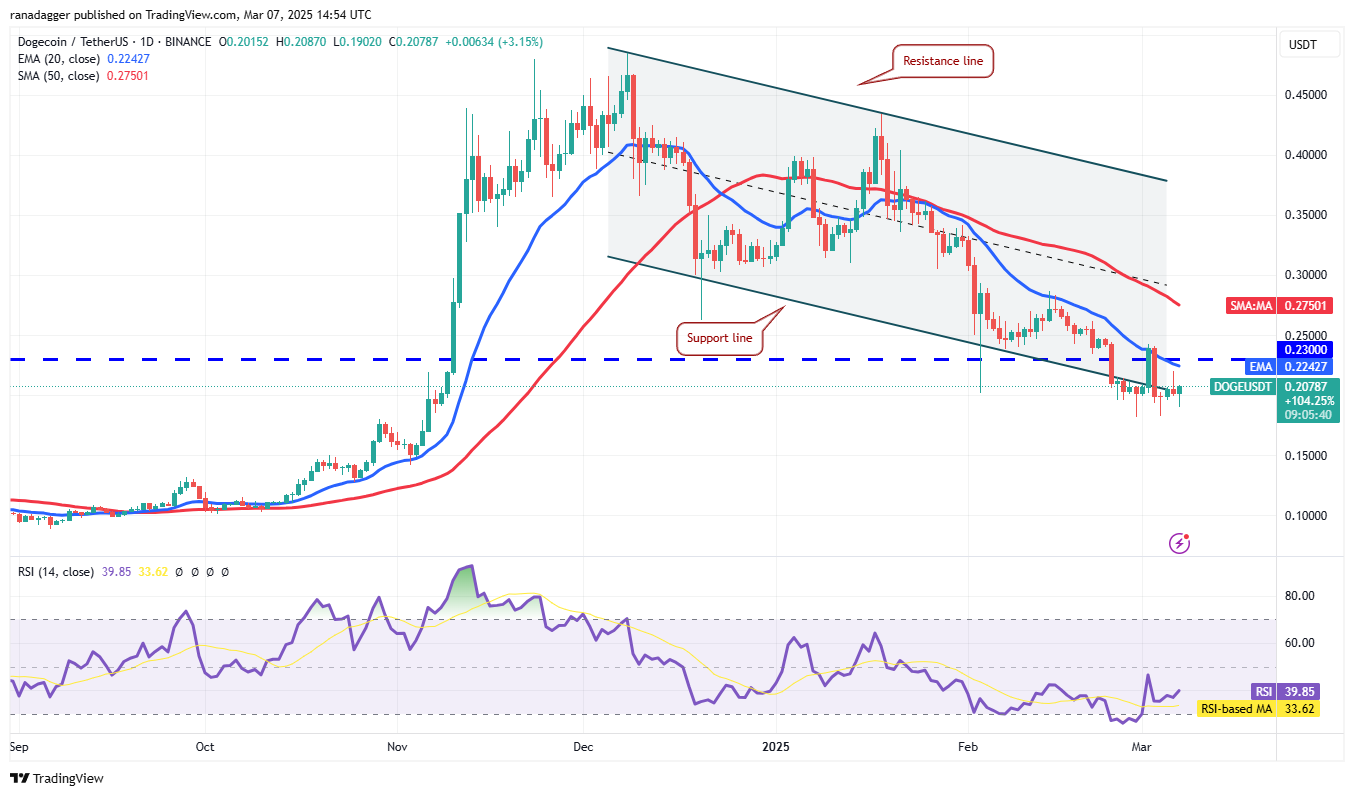
A break below $0.18 would signal the start of a new downtrend, potentially leading to a decline to $0.14 and then to $0.10, where buying support is expected.
低于$ 0.18的休息时间将标志着新的下降趋势的开始,可能会导致预期购买支持的情况下下降至0.14美元,然后下降到0.10美元。
Conversely, a break above the 20-day EMA would invalidate this bearish outlook, potentially leading to a rise to the 50-day SMA ($0.27). The pair may then consolidate within the descending channel.
相反,超过20天EMA的突破将使这种看跌的前景无效,这可能导致50天的SMA(0.27美元)。然后,这对可以在降信道中合并。
Pi Price Analysis
PI价格分析
Buyers failed to sustain Pi (PI) above $2 on March 5th, indicating weak demand at higher levels.
3月5日,买家未能将PI(PI)维持在2美元以上,这表明需求较高。
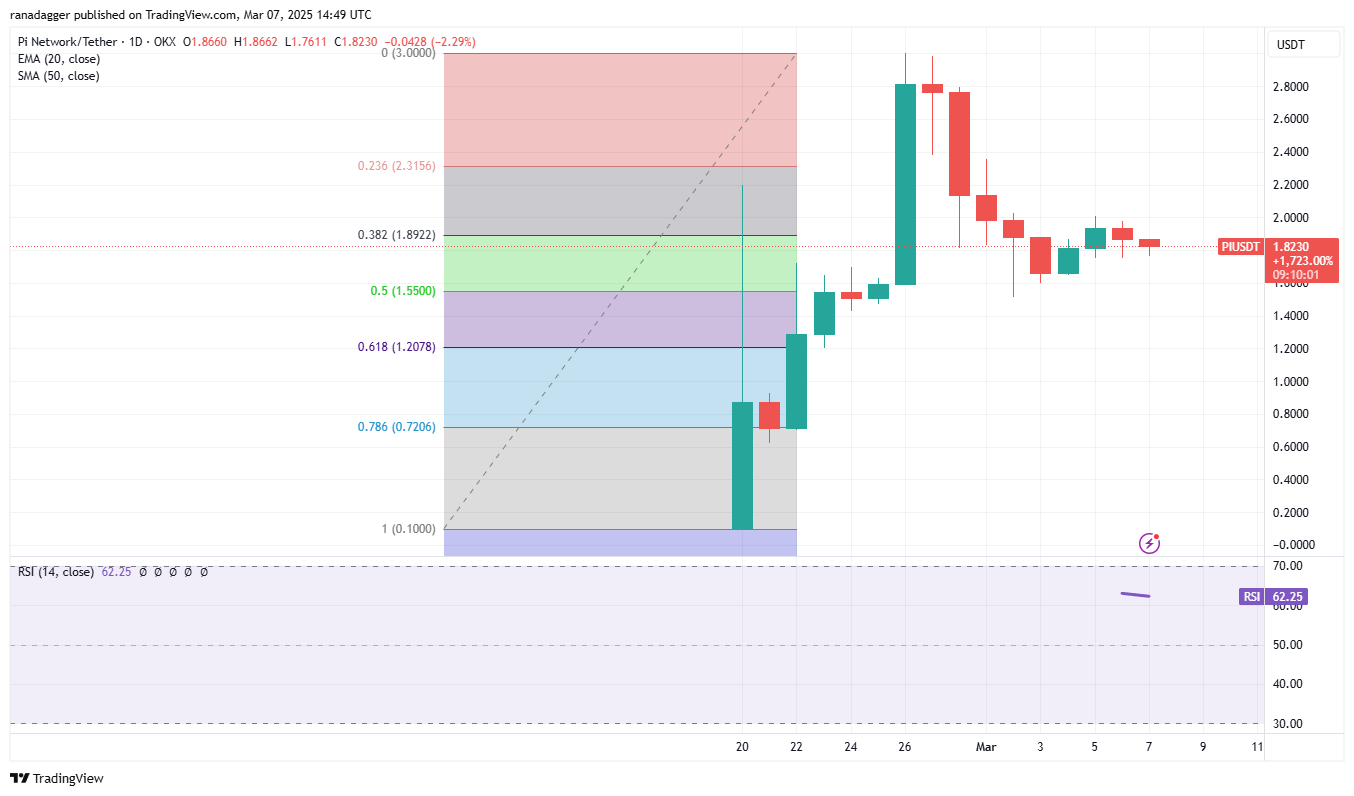
Bears will aim to push the price down to $1.60 and then to $1.51. A rebound from $1.51 could establish a short-term trading range between $1.51 and $2.
熊的目标是将价格降低到1.60美元,然后将价格降至1.51美元。从$ 1.51的反弹可以建立1.51美元至2美元之间的短期交易范围。
A break above $2 would signal a bullish reversal, potentially leading to a rise to $2.35 and then to $2.80. A break below $1.51 could lead to a decline to the 61.8% Fibonacci retracement level of $1.20.
超过2美元的休息时间将表明看涨的逆转,可能会导致2.35美元上涨,然后增加到2.80美元。 低于$ 1.51的休息可能会导致下降至61.8%的斐波那契回试1.20美元。
Hedera Price Analysis
Hedera价格分析
Hedera (HBAR) has traded between moving averages, suggesting potential for increased range expansion.
Hedera(HBAR)在移动平均值之间进行了交易,这表明可能增加范围扩展。
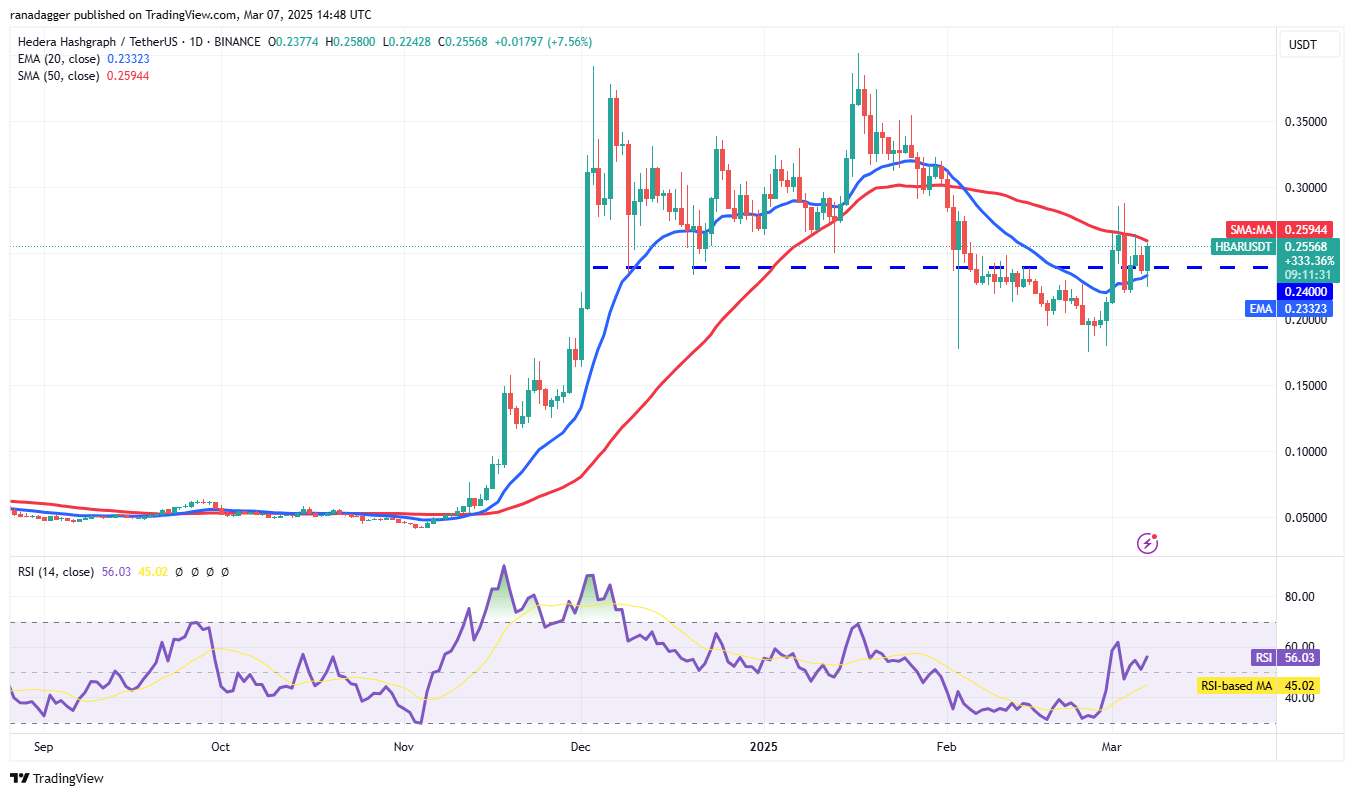
A break above the 50-day SMA ($0.26) could propel the HBAR/USDT pair to $0.29, a key resistance level. A successful breakout could signal the end of the correction and lead to a rise to $0.35.
超过50天SMA(0.26美元)的突破可能会使HBAR/USDT对$ 0.29,这是一个键阻力水平。 成功的突破可能标志着校正的结束,并导致上涨至0.35美元。
Conversely, a close below $0.22 would indicate bear dominance, potentially leading to a decline to $0.17, where buying support is anticipated.
相反,低于$ 0.22的收盘价将表明熊的统治地位,可能导致预计购买支持的情况下降到0.17美元。
Chainlink Price Analysis
连锁价格分析
Chainlink (LINK) closed above the 20-day EMA ($16.81) on March 6th, showing buying pressure at lower levels.
3月6日,ChainLink(Link)在20天EMA($ 16.81)上面关闭,显示较低水平的购买压力。
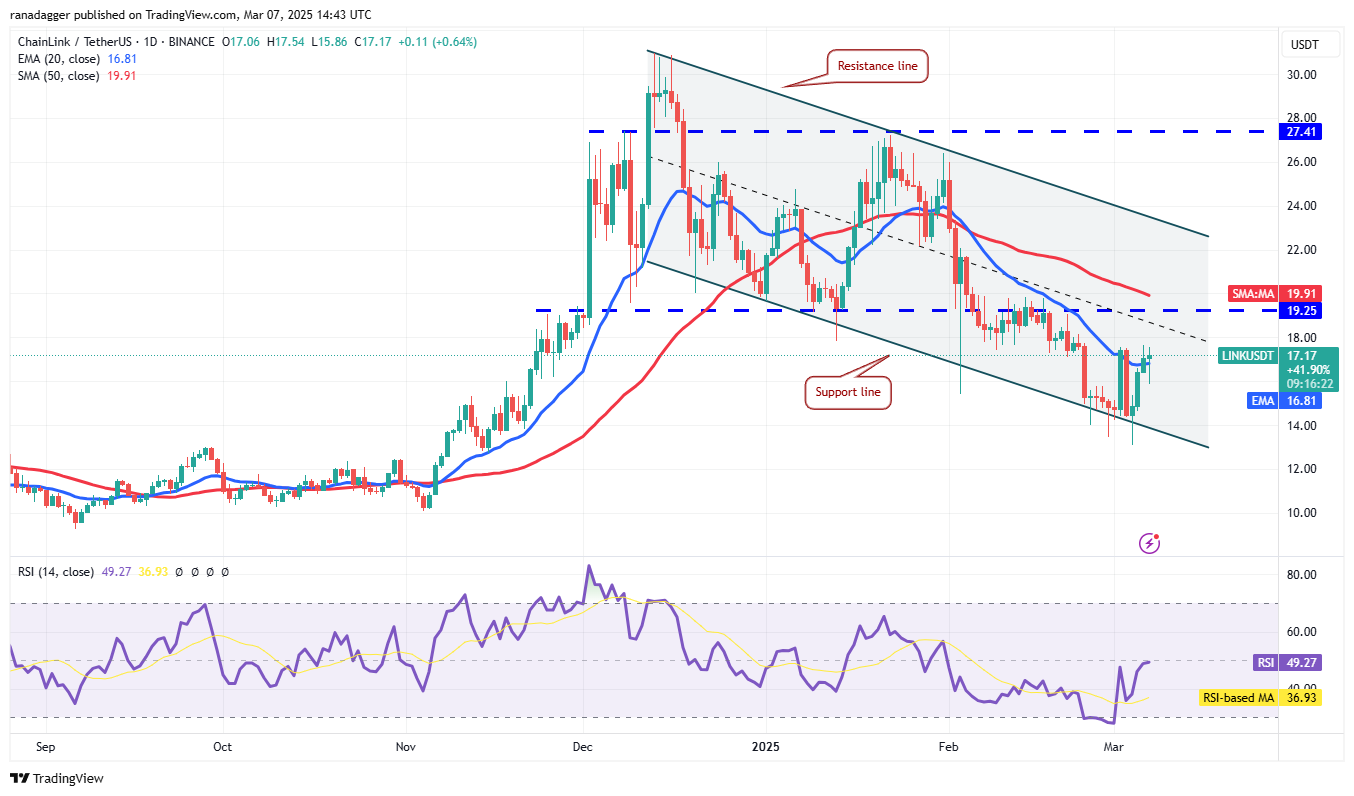
Minor resistance exists at $18. A breakout could lead to a rise to the 50-day SMA ($19.91), potentially extending the range-bound trading within the channel. A sustained break above the resistance line would confirm a trend change.
较小的阻力为18美元。 突破可能会导致50天的SMA($ 19.91)上升,并有可能在渠道内扩展范围内的交易。 在阻力线上的持续断裂将确认趋势变化。
A break below $13 would favor bears, potentially leading to a decline to $10.
低于13美元的休息将有利于熊,可能导致下降至10美元。
Disclaimer: This article does not provide investment advice. All investment decisions involve risk, and readers should conduct thorough research before making any investment.
免责声明:本文不提供投资建议。所有投资决策都涉及风险,读者应在进行任何投资之前进行彻底的研究。
 CFN
CFN DogeHome
 Cryptopolitan
 Times Tabloid
 TheCoinrise
 CFN
CFN CFN
CFN


