

Bitcoin (BTC) rebounded from its intraday low on March 7th and is attempting to break above the $90,000 resistance level, suggesting buying pressure at lower prices. This followed a sell-off after the US Strategic Bitcoin Reserve executive order, signed by President Trump, fell short of market expectations.
ビットコイン(BTC)は、3月7日に日中低から回復し、90,000ドルのレジスタンスレベルを超えようとしており、より低い価格でのプレッシャーの購入を示唆しています。 これは、トランプ大統領が署名した米国の戦略的ビットコインリザーブの行政命令が市場の期待に達しなかった後、売却に続きました。
However, some analysts view the reserve's creation as bullish, anticipating other nations will follow suit. This development also alleviates concerns some institutional investors have about Bitcoin investment. Swan Bitcoin CEO Cory Klippsten told Cointelegraph that Bitcoin is in a consolidation phase, but this isn't necessarily the end of the bull run. He predicts a new all-time high above $109,000 before June.
しかし、一部のアナリストは、保護区の創造物を強気と見なしており、他の国々が追随すると予想しています。 また、この開発は、一部の機関投資家がビットコイン投資について持っている懸念を軽減します。 Swan Bitcoin CEOのCory KlippstenはCointelegraphに、Bitcoinは統合段階にあると語ったが、これは必ずしもブルランの終わりではない。 彼は、6月までに109,000ドルを超える新しい史上最高値を予測しています。
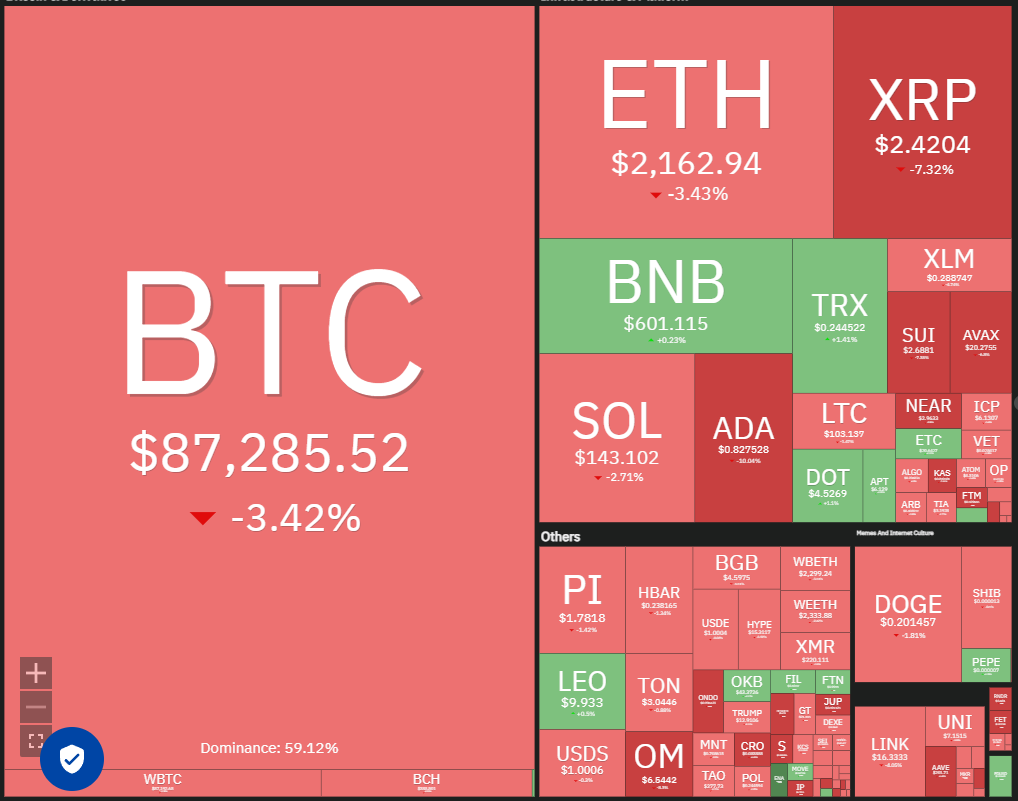
Not all analysts share this optimistic short-term outlook. Bitfinex analysts stated to Cointelegraph that Bitcoin is likely to remain range-bound due to the lack of further US purchases. Nevertheless, they consider the reserve a positive step, describing it as a softer approach likely to encounter less resistance and provide a good starting point for experimenting with Bitcoin as a reserve asset.
すべてのアナリストがこの楽観的な短期的な見通しを共有しているわけではありません。 Bitfinexのアナリストは、Cointelegraphに、さらに米国の購入が不足しているため、Bitcoinは範囲を維持する可能性が高いと述べました。 それにもかかわらず、彼らは保護区を肯定的なステップと考えており、それを抵抗が少ない可能性のあるより柔らかいアプローチとして説明し、予備資産としてビットコインを実験するための良い出発点を提供します。
Could Bitcoin sustain a price above $90,000, and would this lift altcoins? Let's examine the charts of the top 10 cryptocurrencies.
ビットコインは90,000ドルを超える価格を維持できますか?上位10の暗号通貨のチャートを調べましょう。
Bitcoin Price Analysis
ビットコインの価格分析
Bitcoin rebounded from the $85,000 level on March 7th, suggesting bulls are attempting to establish a higher low.
ビットコインは3月7日に85,000ドルのレベルから回復し、ブルズがより高い低値を確立しようとしていることを示唆しています。
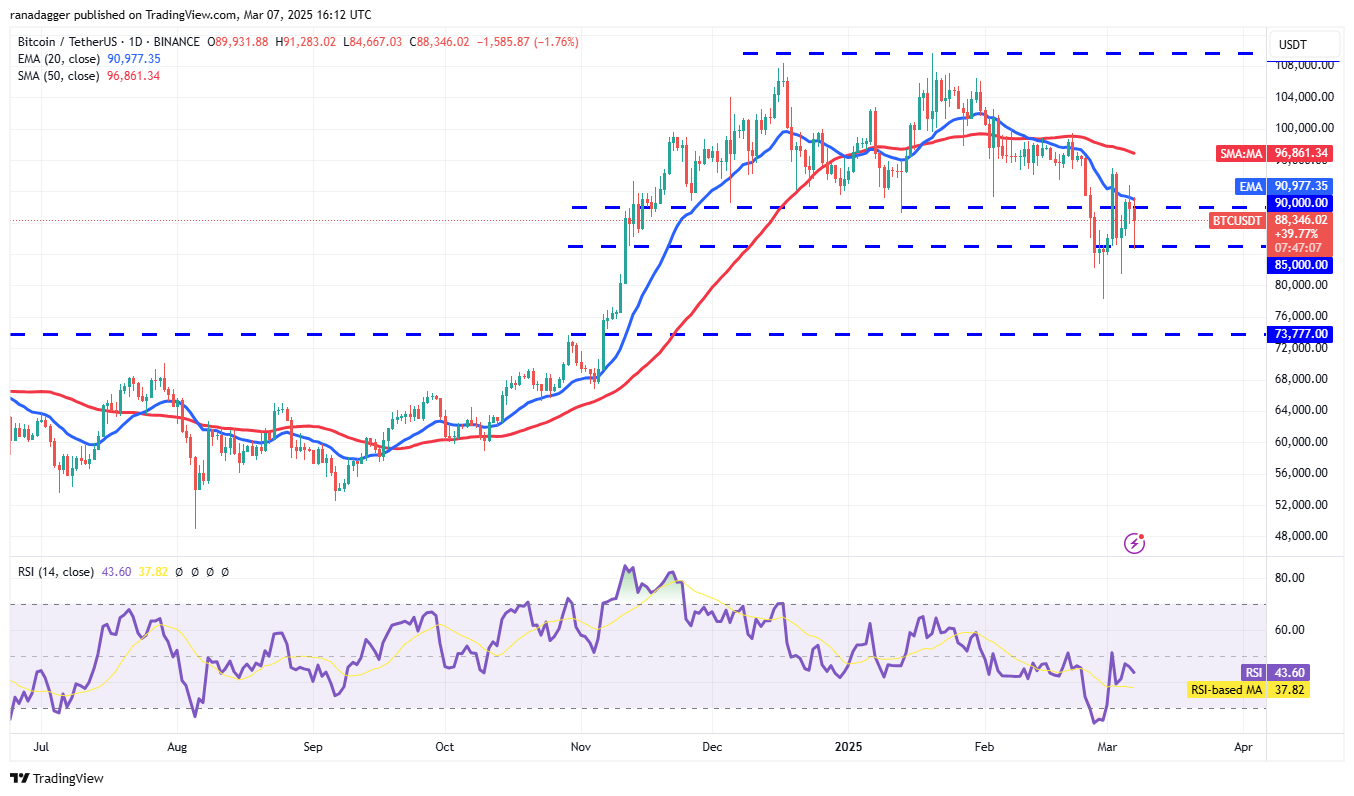
A decisive close above the 20-day exponential moving average ($90,977) would signal a bullish resurgence. The BTC/USDT pair could then rise to the 50-day simple moving average ($96,861). Resistance is anticipated between the 50-day SMA and $100,000; however, a bullish breakout could propel the pair towards $109,588.
20日間の指数移動平均(90,977ドル)を超える決定的な閉鎖は、強気の復活を示します。 BTC/USDTペアは、50日間の単純な移動平均(96,861ドル)に上昇する可能性があります。 50日間のSMAと100,000ドルの間で抵抗が予想されます。ただし、強気のブレイクアウトは、ペアを109,588ドルに推進する可能性があります。
Conversely, a sustained break below $85,000 would favor bears, potentially leading to a decline to $78,258 and further to $73,777.
逆に、85,000ドルを下回る持続的なブレークはクマを支持し、潜在的に78,258ドルに減少し、さらに73,777ドルになります。
Ether Price Analysis
エーテル価格分析
Ether (ETH) dipped to the $2,111 support on March 7th, demonstrating continued bear pressure. However, the long lower wick on the candlestick suggests bullish defense of this level.
Ether(ETH)は3月7日に2,111ドルのサポートに浸し、継続的なクマの圧力を示しました。 ただし、ろうそく足の長い低い芯は、このレベルの強気な防御を示唆しています。
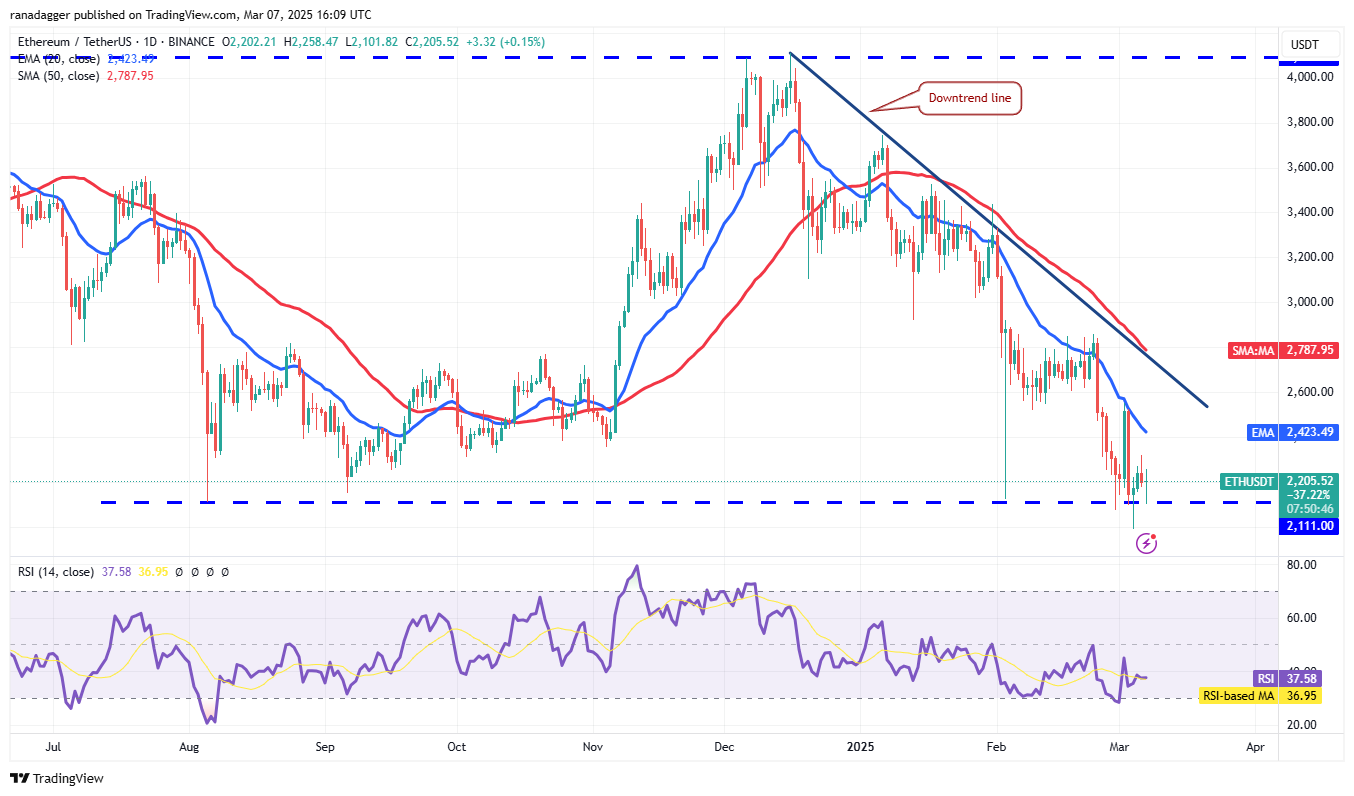
Bulls will aim to push the price towards the 20-day EMA ($2,423), a key short-term indicator. A close above this EMA would signal weakening bear dominance. A break above the downtrend line would confirm a bullish reversal.
ブルズは、主要な短期指標である20日間のEMA($ 2,423)に価格を押し上げることを目指します。 このEMAの上の近くは、熊の支配を弱めることを示すでしょう。 下降トレンドラインを上回るブレークは、強気の逆転を確認します。
Conversely, a reversal from the current level or a break below $2,111 would suggest a continuation of the downtrend, potentially leading to a drop to $1,750.
逆に、現在のレベルからの逆転または2,111ドルを下回るブレークは、下降トレンドの継続を示唆し、1,750ドルに低下する可能性があります。
XRP Price Analysis
XRP価格分析
XRP (XRP) closed above the 20-day EMA ($2.49) on March 6th, but failed to overcome the 50-day SMA ($2.68).
XRP(XRP)は3月6日に20日間のEMA(2.49ドル)を超えて閉じましたが、50日間のSMA(2.68ドル)を克服できませんでした。
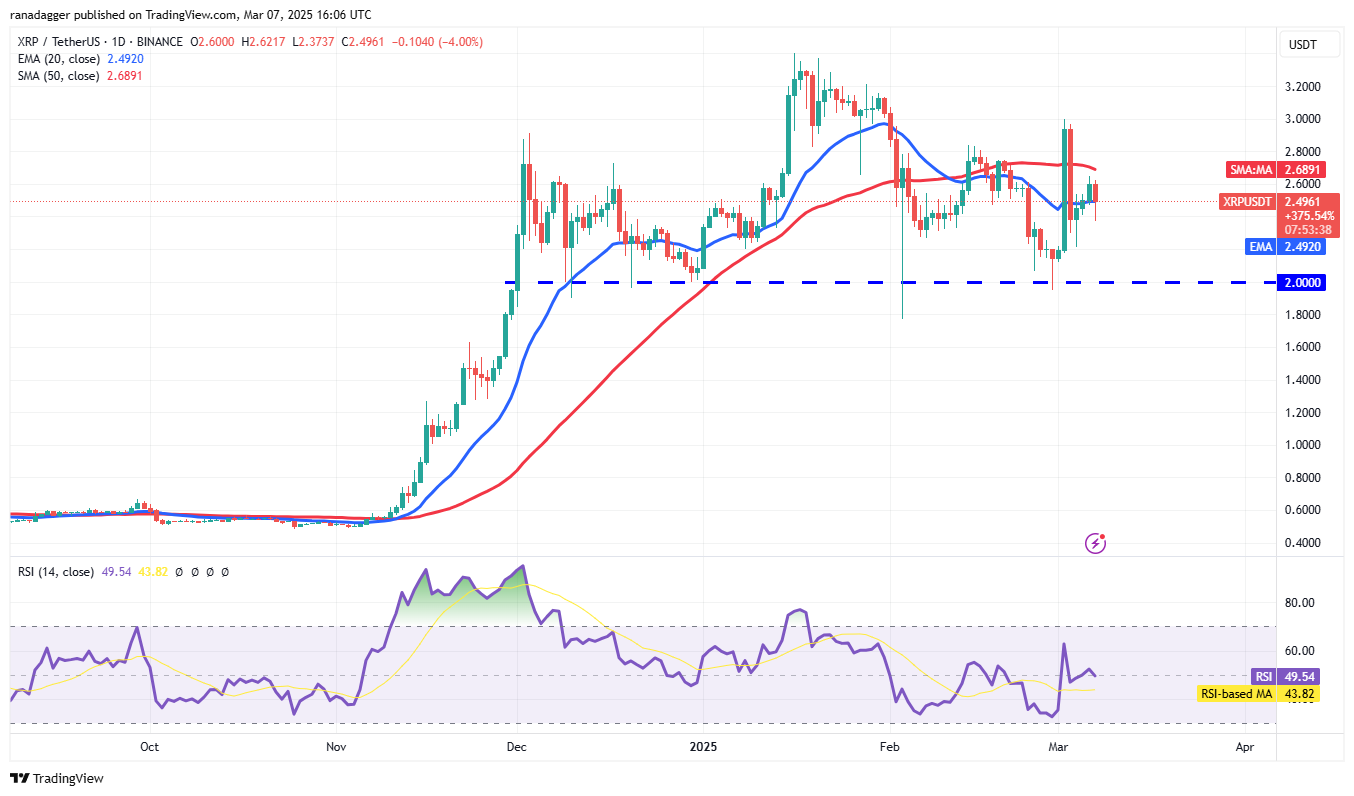
The relatively flat 20-day EMA and RSI near the midpoint suggest short-term range-bound trading. A break below the 20-day EMA could lead to a decline to $2.20, a level expected to see strong buying support. A bounce from this zone could establish a trading range between $2.20 and $3.
中間点近くの比較的フラットな20日間のEMAとRSIは、短期範囲に縛られた取引を示唆しています。 20日間のEMAを下回るブレークは、2.20ドルに減少する可能性があります。これは、強力な購入サポートが見られるレベルです。 このゾーンからのバウンスは、2.20ドルから3ドルの取引範囲を確立する可能性があります。
A break above $3 could trigger a move towards $3.40, with significant resistance anticipated at that level. A successful breakout above $3.40 could lead to a surge towards $5.
3ドルを超えるブレークは、3.40ドルへの移動を引き起こす可能性があり、そのレベルでは大きな抵抗が予想されます。 3.40ドルを超えるブレイクアウトが成功すると、5ドルに急増する可能性があります。
BNB Price Analysis
BNB価格分析
BNB (BNB) reversed from the 20-day EMA ($616) on March 6th, but bulls held their ground relatively well.
BNB(BNB)は3月6日に20日間のEMA($ 616)から逆転しましたが、ブルズは比較的うまくいきました。
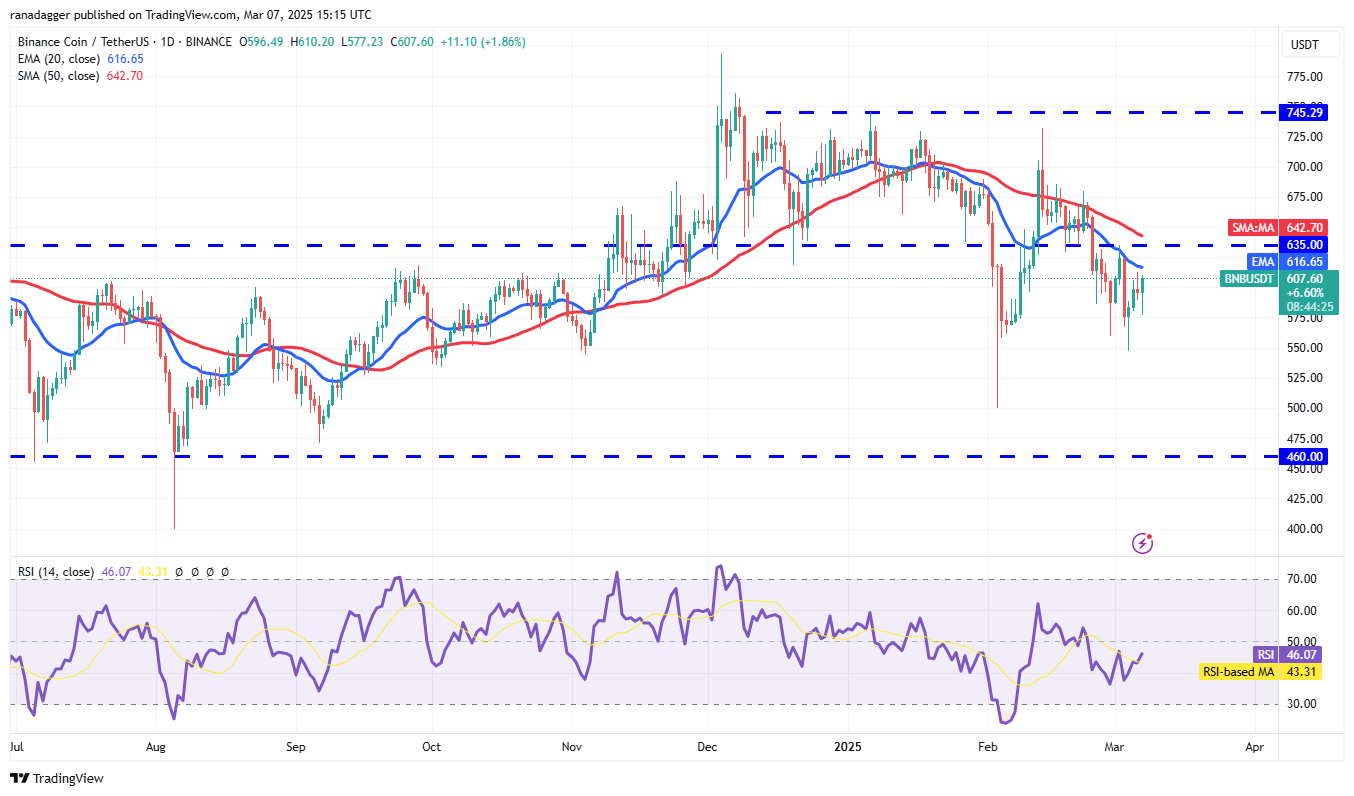
This increases the probability of a break above the 20-day EMA. Any subsequent rally is expected to face resistance at the 50-day SMA ($642), but a breakout could lead to a rise to $686.
これにより、20日間のEMAを超えるブレークの確率が向上します。 その後のラリーは、50日間のSMA(642ドル)で抵抗に直面すると予想されますが、ブレイクアウトは686ドルに上昇する可能性があります。
A break below the $546 support level would invalidate this bullish outlook, potentially leading to a decline to $500, where buying support is likely.
546ドルのサポートレベルを下回るブレークは、この強気の見通しを無効にし、購入サポートが可能性が高い場合に500ドルに減少する可能性があります。
Solana Price Analysis
ソラナ価格分析
Solana (SOL) has found support at the uptrend line, indicating a potential recovery attempt.
Solana(Sol)は、アップトレンドラインでサポートを見つけ、潜在的な回復の試みを示しています。
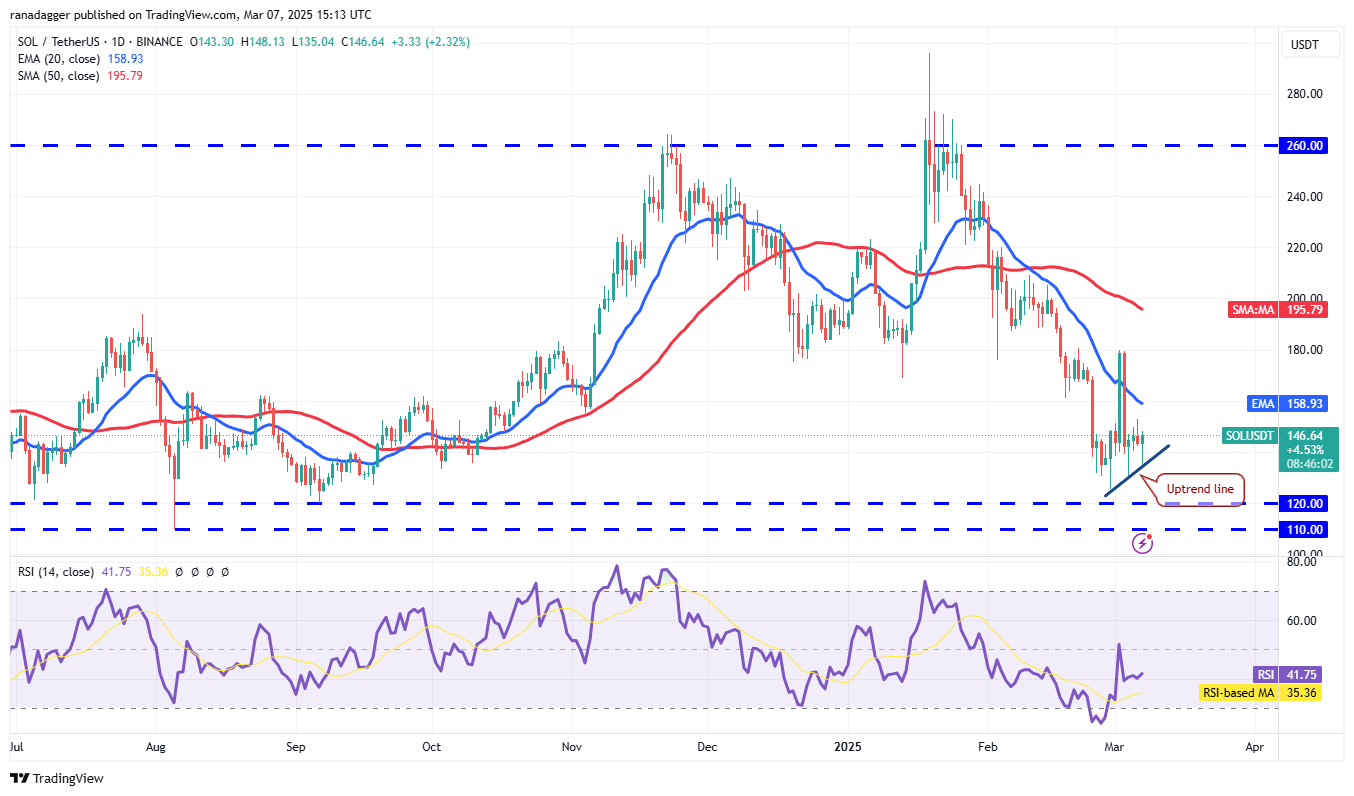
The 20-day EMA ($158) represents key overhead resistance. A break above this level could send the SOL/USDT pair to $180, with further resistance anticipated at this level. A successful breakout above $180 could signal the end of the correction, potentially leading to a rise to $220.
20日間のEMA($ 158)は、主要なオーバーヘッド抵抗を表しています。 このレベルを超えるブレークは、Sol/USDTペアを180ドルに送信する可能性があり、このレベルでさらに抵抗が予想されます。 180ドルを超えるブレイクアウトが成功すると、修正の終わりを示す可能性があり、潜在的に220ドルに上昇する可能性があります。
Conversely, a break below the uptrend line would suggest continued bear pressure, potentially leading to a decline to $120 and then to $110.
逆に、アップトレンドラインを下回るブレークは、継続的な熊の圧力を示唆し、潜在的に120ドルに減少し、その後110ドルに陥ることを示唆します。
Cardano Price Analysis
カルダノ価格分析
Cardano (ADA) reversed from $1.02 on March 5th and reached the 20-day EMA ($0.82) on March 7th.
カルダノ(ADA)は3月5日の1.02ドルから逆転し、3月7日に20日間のEMA($ 0.82)に到達しました。
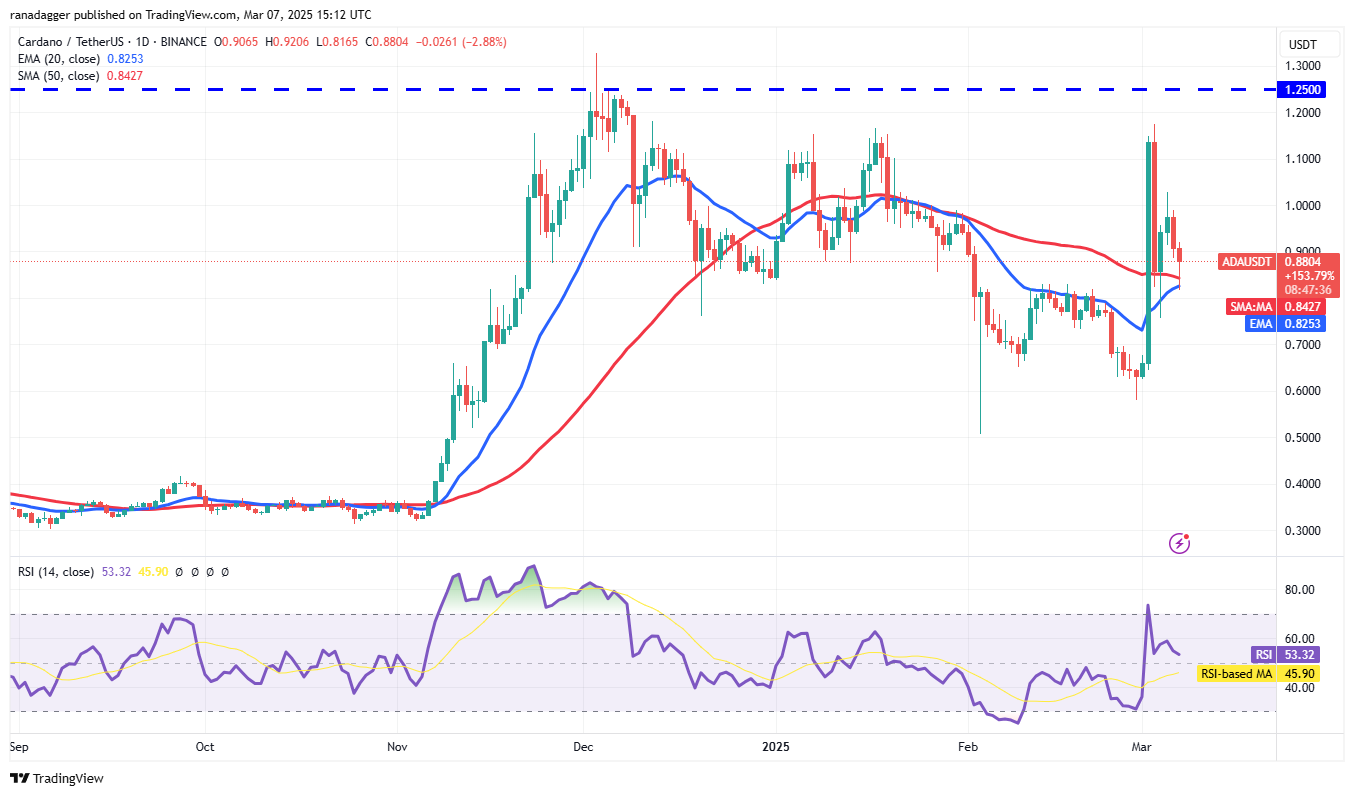
A strong rebound from the 20-day EMA could allow bulls to push the ADA/USDT pair back above $1.02, potentially leading to a rally towards the $1.25 resistance level.
20日間のEMAからの強力なリバウンドにより、ブルはADA/USDTペアを1.02ドルを超えて押し戻すことができ、潜在的に1.25ドルのレジスタンスレベルに向かって集会につながる可能性があります。
Conversely, a reversal from $1.02 would indicate continued bear pressure, potentially establishing a trading range between $1.02 and $0.75. A break below $0.75 could lead to a decline to $0.60.
逆に、1.02ドルからの逆転は、継続的なクマの圧力を示し、潜在的に1.02ドルから0.75ドルの取引範囲を確立する可能性があります。 0.75ドルを下回るブレークは、0.60ドルに減少する可能性があります。
Dogecoin Price Analysis
Dogecoin価格分析
Buyers attempted a Dogecoin (DOGE) recovery on March 6th but faced selling pressure at the 20-day EMA ($0.22).
バイヤーは3月6日にDogecoin(Doge)の回復を試みましたが、20日間のEMA(0.22ドル)で販売圧力に直面しました。
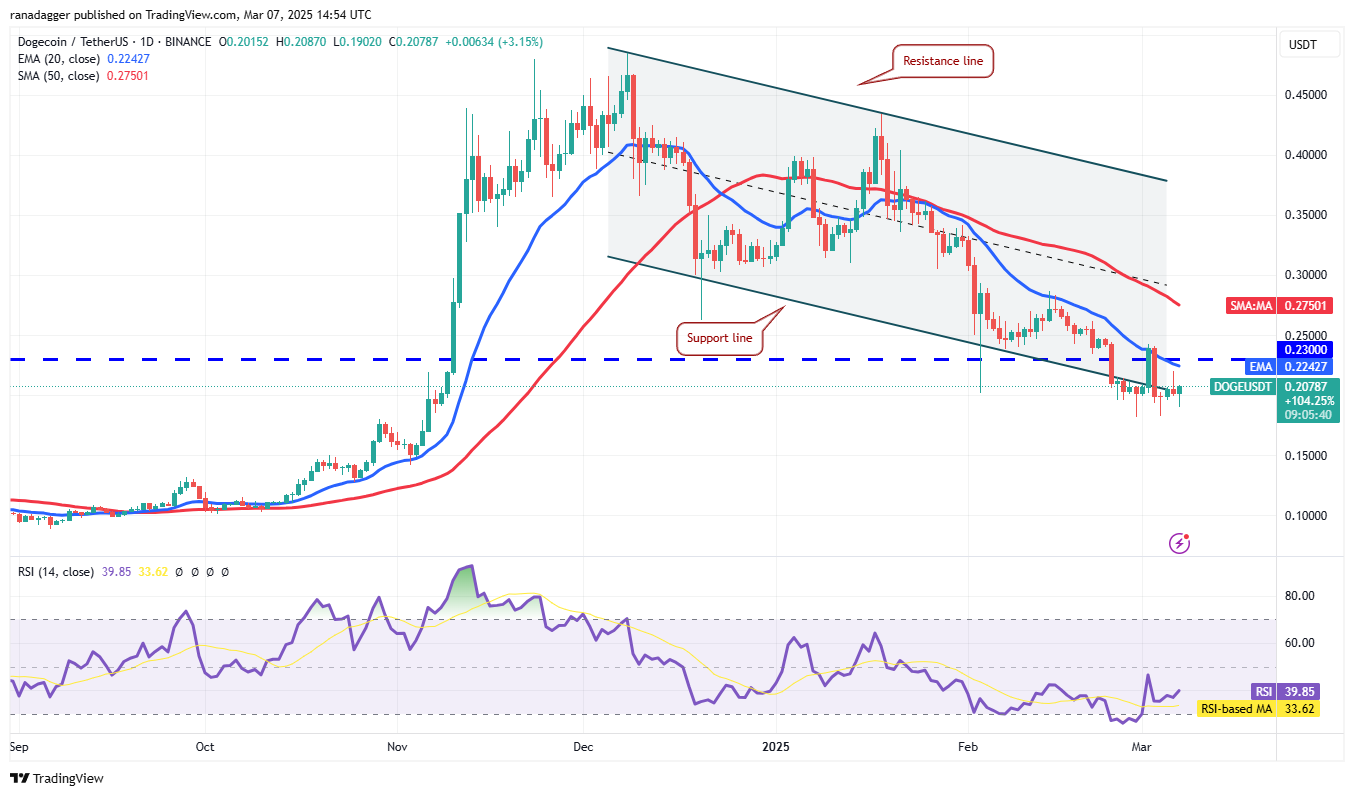
A break below $0.18 would signal the start of a new downtrend, potentially leading to a decline to $0.14 and then to $0.10, where buying support is expected.
0.18ドルを下回るブレークは、新しい下降トレンドの開始を示し、潜在的に0.14ドルに減少し、その後0.10ドルになり、購入サポートが予想されます。
Conversely, a break above the 20-day EMA would invalidate this bearish outlook, potentially leading to a rise to the 50-day SMA ($0.27). The pair may then consolidate within the descending channel.
逆に、20日間のEMAを超えるブレークは、この弱気な見通しを無効にし、50日間のSMA(0.27ドル)の上昇につながる可能性があります。その後、ペアは降順チャネル内で統合することができます。
Pi Price Analysis
PI価格分析
Buyers failed to sustain Pi (PI) above $2 on March 5th, indicating weak demand at higher levels.
バイヤーは、3月5日にPI(PI)を2ドル以上維持することに失敗し、より高いレベルでの需要が弱いことを示しています。
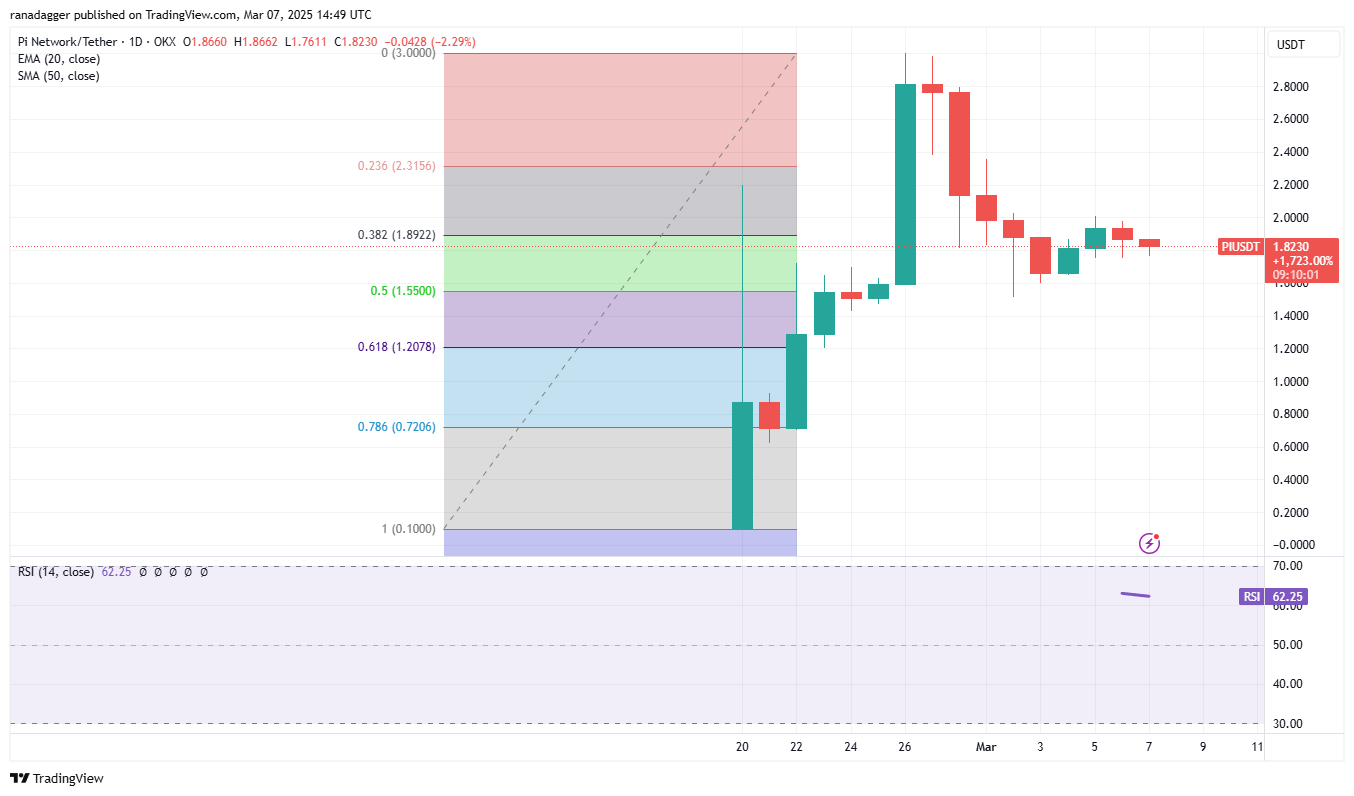
Bears will aim to push the price down to $1.60 and then to $1.51. A rebound from $1.51 could establish a short-term trading range between $1.51 and $2.
ベアーズは、価格を1.60ドルに引き下げ、その後1.51ドルに引き下げることを目指します。 1.51ドルからのリバウンドは、1.51ドルから2ドルの間の短期取引範囲を確立する可能性があります。
A break above $2 would signal a bullish reversal, potentially leading to a rise to $2.35 and then to $2.80. A break below $1.51 could lead to a decline to the 61.8% Fibonacci retracement level of $1.20.
2ドルを超えるブレークは、強気の逆転を示し、潜在的に2.35ドルに上昇し、その後2.80ドルになります。 1.51ドルを下回るブレークは、61.8%のフィボナッチリトレースメントレベルの1.20ドルを減少させる可能性があります。
Hedera Price Analysis
ヘデラ価格分析
Hedera (HBAR) has traded between moving averages, suggesting potential for increased range expansion.
Hedera(HBAR)は、移動平均の間で取引されており、範囲の拡大の増加の可能性を示唆しています。
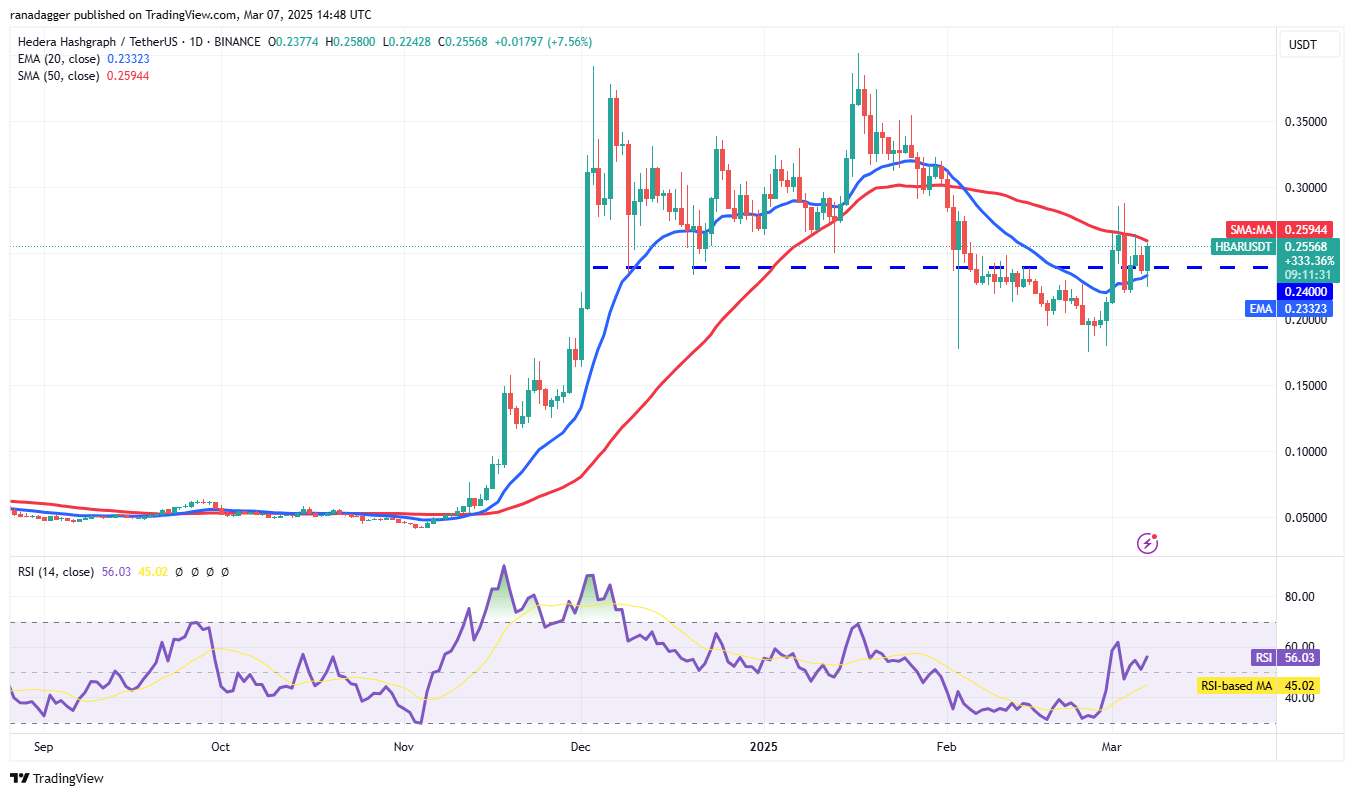
A break above the 50-day SMA ($0.26) could propel the HBAR/USDT pair to $0.29, a key resistance level. A successful breakout could signal the end of the correction and lead to a rise to $0.35.
50日間のSMA(0.26ドル)を超えるブレークは、HBAR/USDTペアを$ 0.29に推進する可能性があります。 ブレイクアウトが成功すると、修正の終わりを示す可能性があり、0.35ドルに上昇する可能性があります。
Conversely, a close below $0.22 would indicate bear dominance, potentially leading to a decline to $0.17, where buying support is anticipated.
逆に、0.22ドルを下回る近づきは、クマの支配を示しており、購入サポートが予想される場合、0.17ドルに減少する可能性があります。
Chainlink Price Analysis
チェーンリンク価格分析
Chainlink (LINK) closed above the 20-day EMA ($16.81) on March 6th, showing buying pressure at lower levels.
ChainLink(リンク)は3月6日に20日間のEMA($ 16.81)を超えて閉鎖され、より低いレベルでのプレッシャーを示しました。
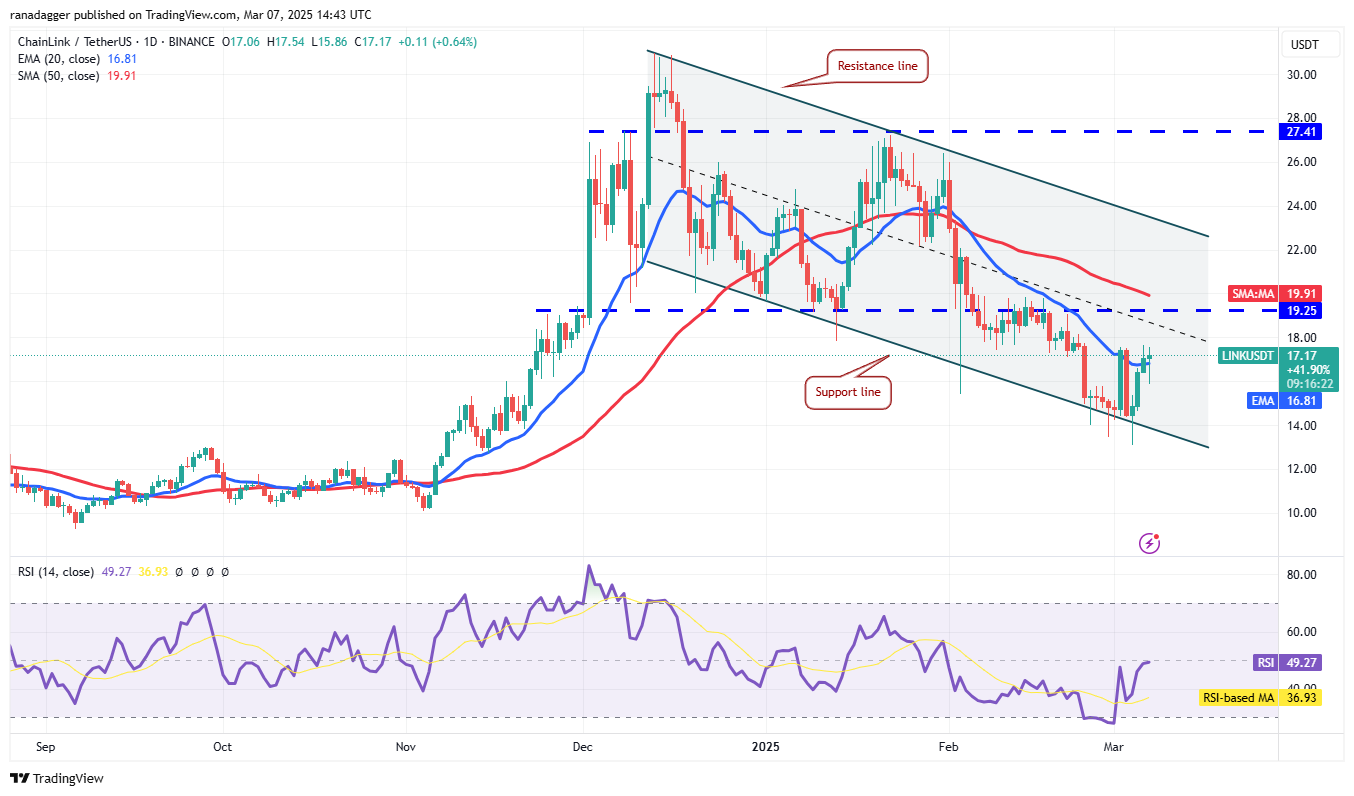
Minor resistance exists at $18. A breakout could lead to a rise to the 50-day SMA ($19.91), potentially extending the range-bound trading within the channel. A sustained break above the resistance line would confirm a trend change.
マイナー抵抗は18ドルで存在します。 ブレイクアウトは、50日間のSMA(19.91ドル)に上昇し、チャネル内の範囲に縛られた取引を拡大する可能性があります。 抵抗ラインを上回る持続的なブレークは、傾向の変化を確認します。
A break below $13 would favor bears, potentially leading to a decline to $10.
13ドルを下回るブレークはクマを支持し、潜在的に10ドルに減少することになります。
Disclaimer: This article does not provide investment advice. All investment decisions involve risk, and readers should conduct thorough research before making any investment.
免責事項:この記事は投資アドバイスを提供していません。すべての投資決定にはリスクが含まれ、読者は投資を行う前に徹底的な調査を行う必要があります。
 Crypto News Land
 Bitcoin Sistemi EN
 U_Today
 U_Today
 Crypto Daily™
 crypto.news
 BlockchainReporter
 DogeHome
 Crypto Front News


