Dogecoin-Analyse: Was passiert auf dem Dogecoin-Markt?
The cryptocurrency market continues to recover from the effects of the decline that started with the opening of Wall Street. Bitcoin, which fell below the $35,000 level during the day, was trading at $35,043 at the time of writing this article. Of course, many altcoins were also negatively affected by this situation, but buying has started to increase in the altcoin market as well. So, what’s happening in the Dogecoin market? Let’s take a closer look.
Der Kryptowährungsmarkt erholt sich weiterhin von den Auswirkungen des Rückgangs, der mit der Eröffnung der Wall Street begann. Bitcoin, das im Laufe des Tages unter die 35.000-Dollar-Marke fiel, wurde zum Zeitpunkt des Verfassens dieses Artikels bei 35.043 Dollar gehandelt. Natürlich waren auch viele Altcoins von dieser Situation negativ betroffen, aber auch auf dem Altcoin-Markt hat die Käufe zugenommen. Was passiert also auf dem Dogecoin-Markt? Lass uns genauer hinschauen.
Dogecoin Chart Analysis
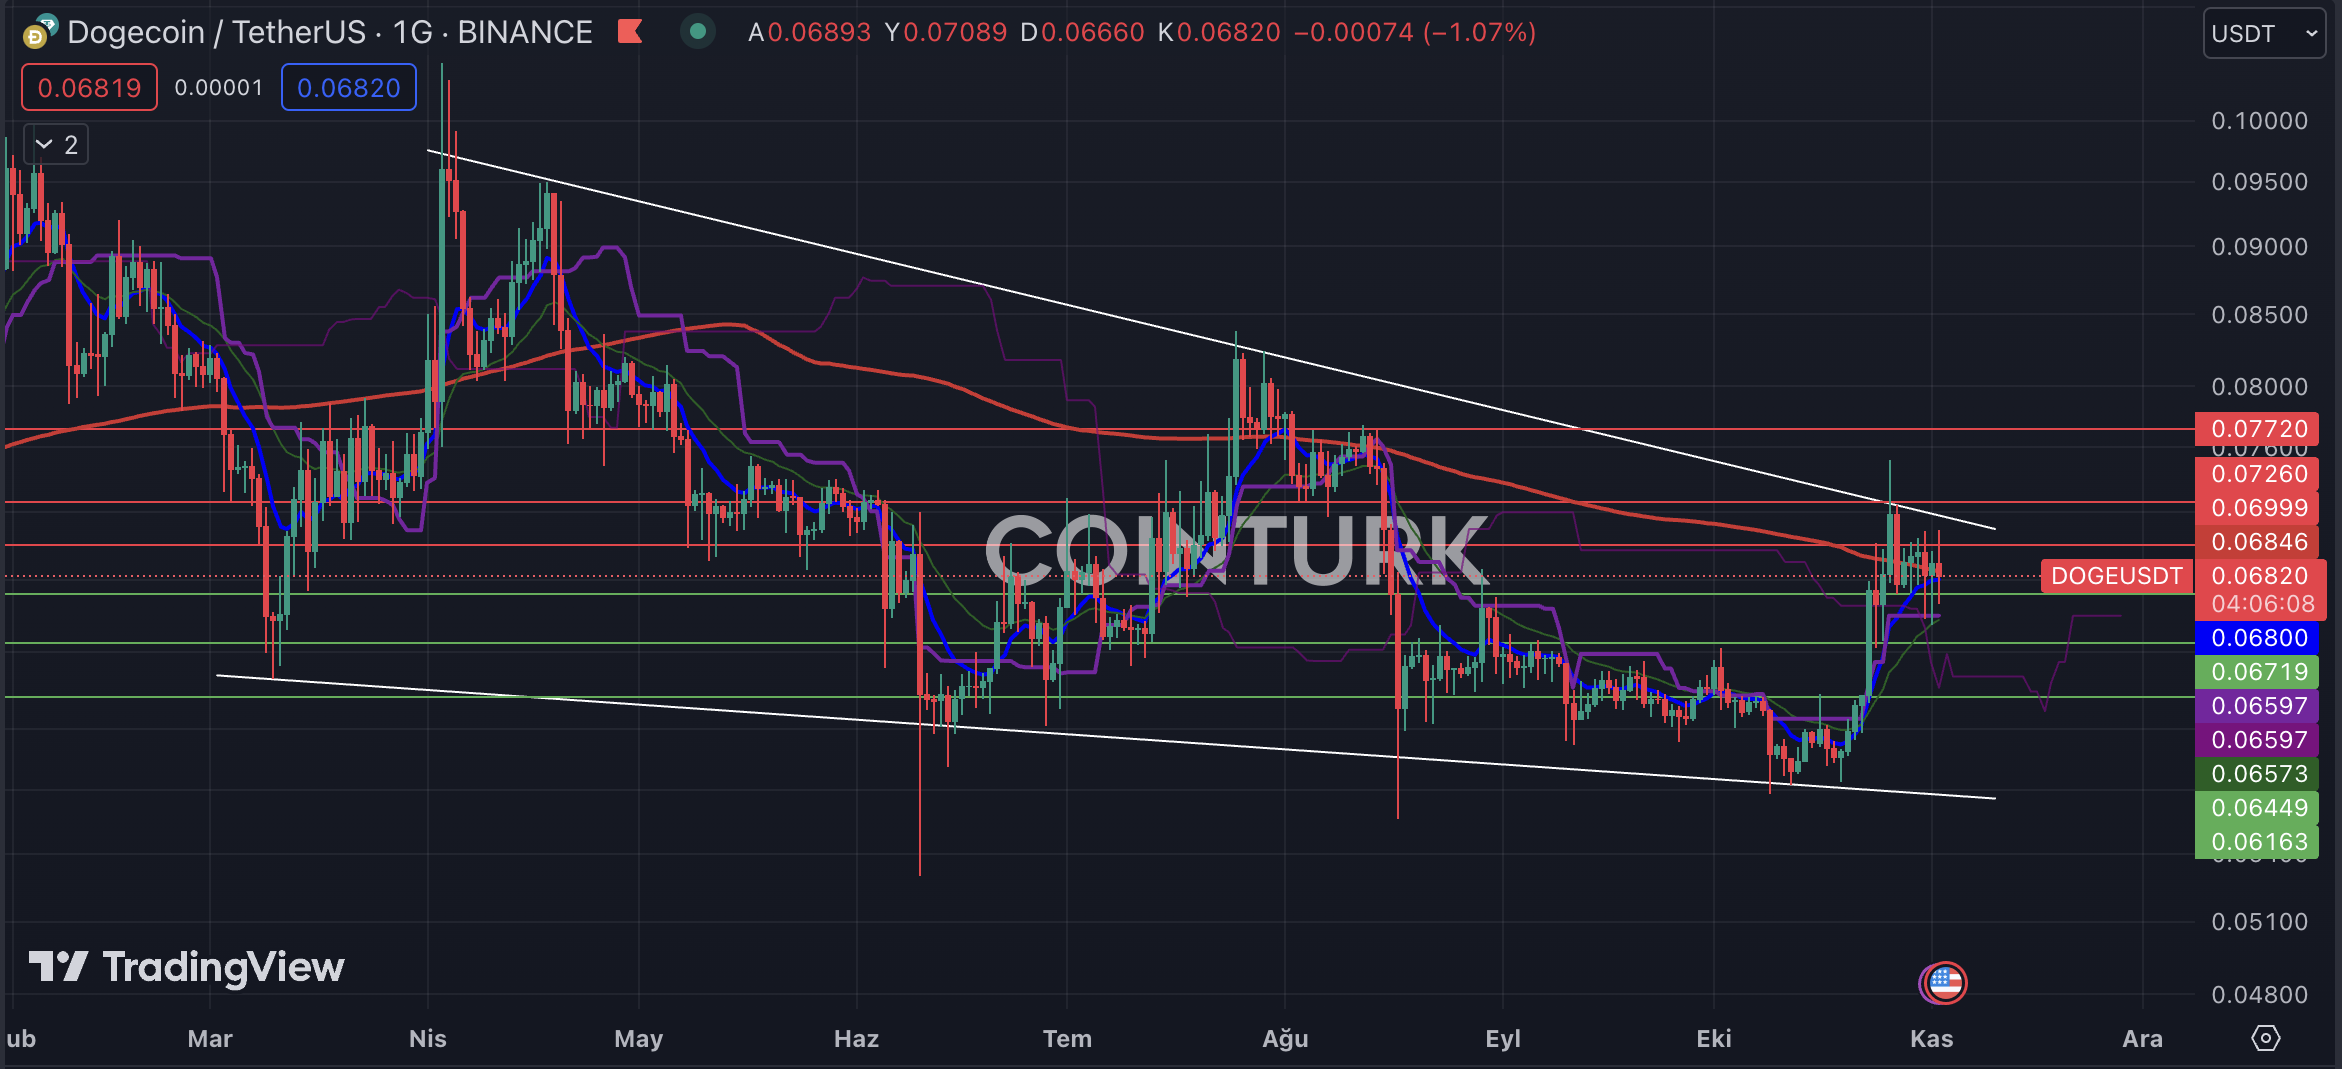
The first notable formation in the daily Dogecoin chart is a descending wedge formation. In this pattern that has been ongoing since March, the DOGE price recently squeezed into a tight range after touching the resistance line. This situation, especially at the EMA 200 (red line) level, may indicate a negative scenario for DOGE.
Analyse des Dogecoin-Charts Die erste bemerkenswerte Formation im täglichen Dogecoin-Chart ist eine absteigende Keilformation. In diesem seit März andauernden Muster drückte sich der DOGE-Preis kürzlich in eine enge Spanne, nachdem er die Widerstandslinie berührt hatte. Diese Situation, insbesondere auf der Ebene des EMA 200 (rote Linie), könnte auf ein negatives Szenario für DOGE hinweisen.
The support levels to watch for DOGE are respectively $0.06719, $0.06449, and $0.06163. Although it may be difficult to talk about any negative scenarios below these supports, contact with the support line can be expected with a daily bar closing below the $0.06163 level.
Die zu beobachtenden Unterstützungsniveaus für DOGE liegen bei 0,06719 $, 0,06449 $ bzw. 0,06163 $. Auch wenn es schwierig sein dürfte, über negative Szenarien unterhalb dieser Unterstützungsniveaus zu sprechen, kann mit einem Kontakt mit der Unterstützungslinie gerechnet werden, wenn der Tagesbalken unter dem Niveau von 0,06163 US-Dollar schließt.
The resistance levels to watch for DOGE are respectively $0.06820, $0.07260, and $0.07720. Especially, a daily bar closing above the $0.07260 level will trigger an upward breakout in the descending wedge formation and this will accelerate the rise of DOGE.
Die Widerstandsniveaus, die es bei DOGE zu beachten gilt, liegen bei 0,06820 $, 0,07260 $ bzw. 0,07720 $. Insbesondere ein Tageskurs, der über dem Niveau von 0,07260 $ schließt, wird einen Ausbruch nach oben in der absteigenden Keilformation auslösen, was den Anstieg von DOGE beschleunigen wird.

DOGE/ETH Chart Analysis
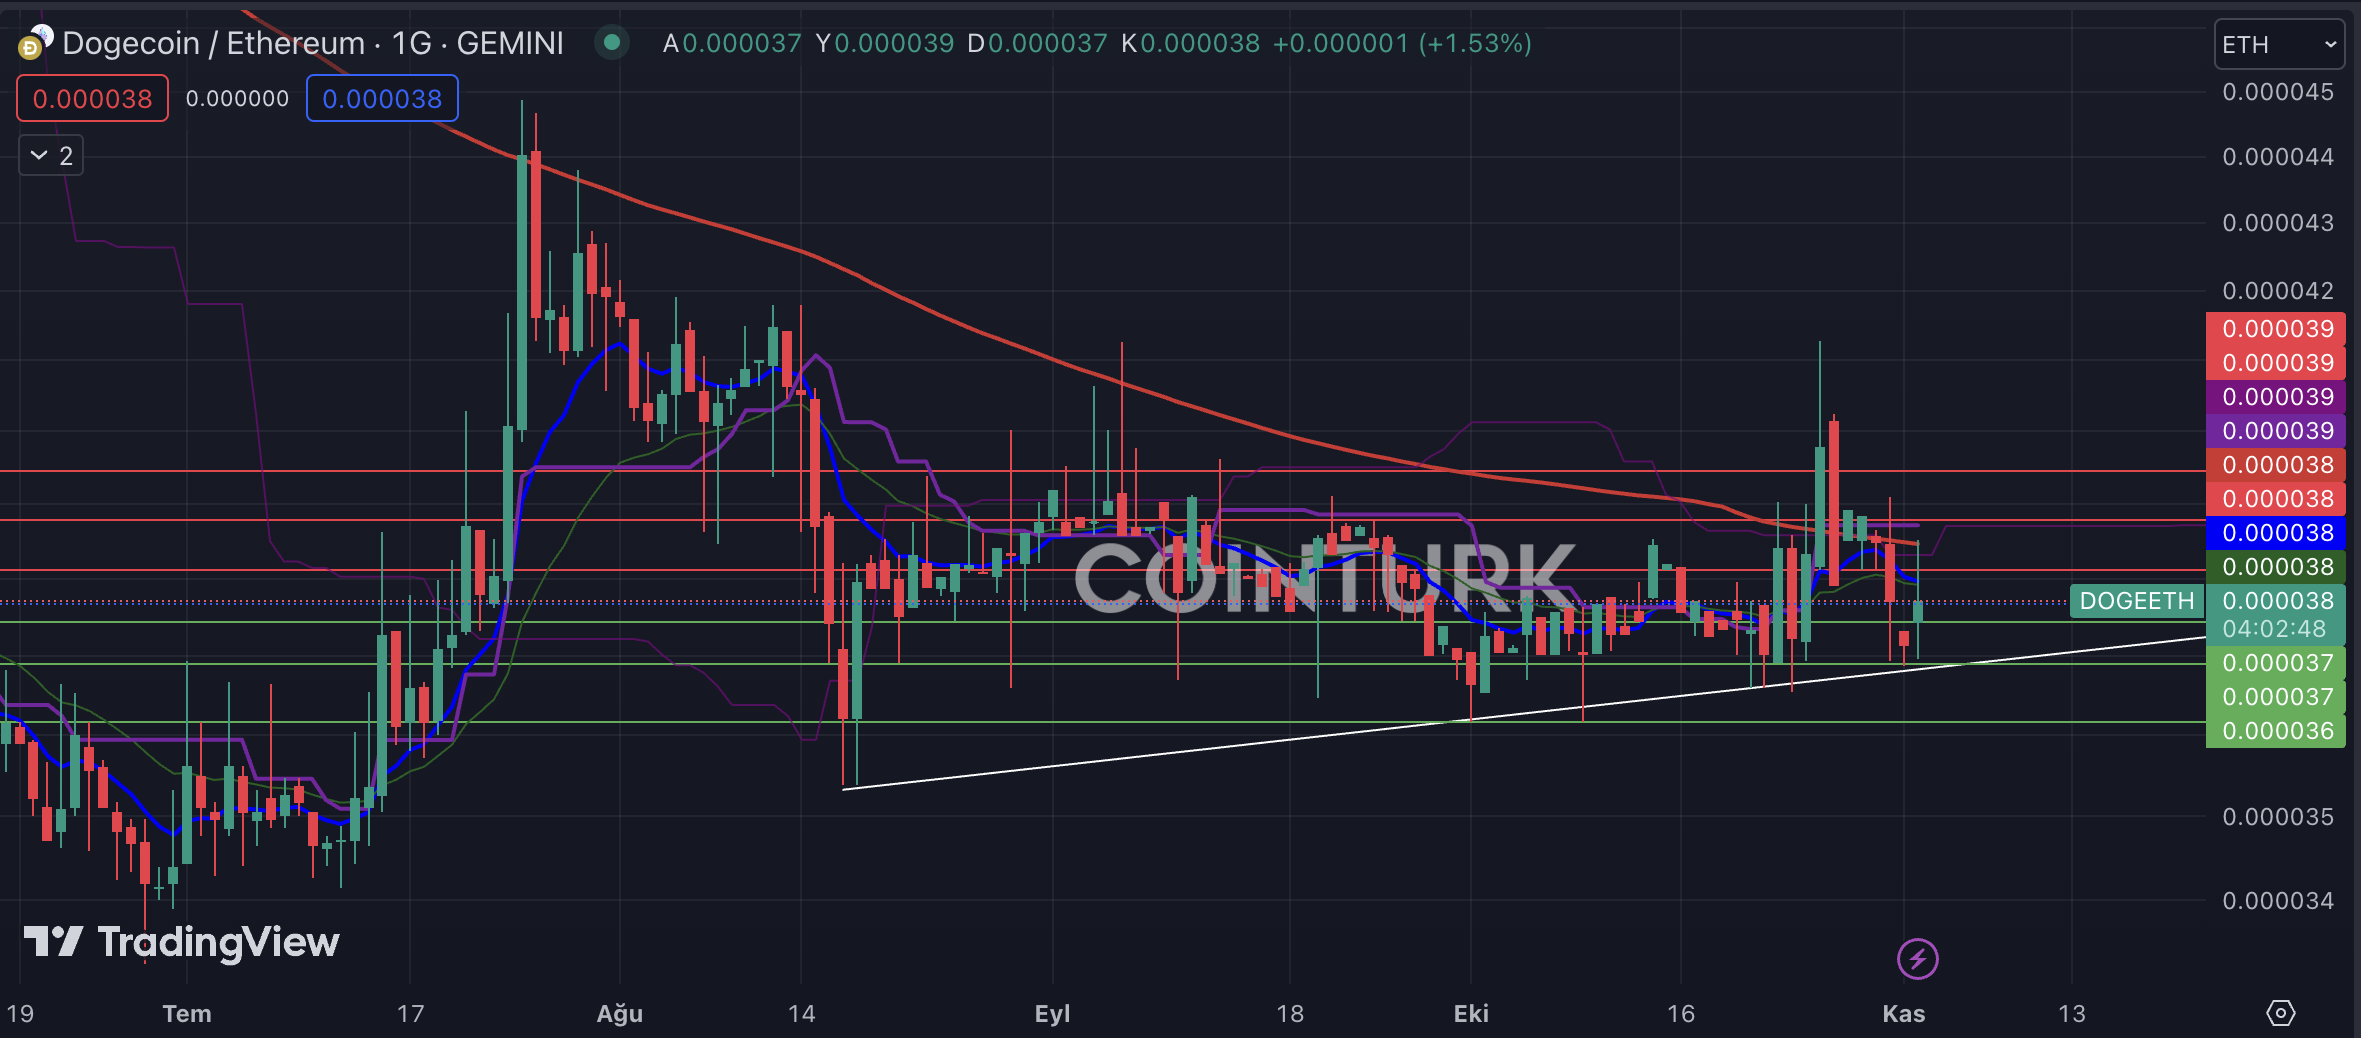
Another notable chart in the DOGE camp is the DOGE/ETH pair. The support trendline that has been in place since August indicates a significant power gain here, and accordingly, positive news flow in the near future could cause Dogecoin to gain value against Ethereum. Also, the recent resistance of the EMA 200 (red line) level is causing pressure on the pair.
DOGE/ETH-Diagrammanalyse Ein weiteres bemerkenswertes Diagramm im DOGE-Lager ist das DOGE/ETH-Paar. Die seit August bestehende Unterstützungstrendlinie deutet hier auf einen deutlichen Machtzuwachs hin und dementsprechend könnte ein positiver Nachrichtenfluss in naher Zukunft dazu führen, dass Dogecoin gegenüber Ethereum an Wert gewinnt. Auch der jüngste Widerstand des EMA 200-Niveaus (rote Linie) übt Druck auf das Paar aus.
The support levels to watch for the DOGE/ETH pair are respectively 0.0000375, 0.0000370, and 0.0000360. Especially, a daily bar closing below the 0.0000360 level can trigger a decline in the pair, causing Ethereum to gain value against DOGE.
Die zu beachtenden Unterstützungsniveaus für das DOGE/ETH-Paar liegen bei 0,0000375, 0,0000370 und 0,0000360. Insbesondere ein Tagesbalken, der unter dem Niveau von 0,0000360 schließt, kann einen Rückgang des Paares auslösen, wodurch Ethereum gegenüber DOGE an Wert gewinnt.
The resistance levels to watch for the DOGE/ETH pair are respectively 0.0000390, 0.0000395, and 0.0000398. Especially, a daily bar closing above the 0.0000395 level, along with breaking above the EMA 200 level, will enable an upward momentum in the pair, causing DOGE to gain value against ETH.
Die zu beachtenden Widerstandsniveaus für das DOGE/ETH-Paar liegen bei 0,0000390, 0,0000395 bzw. 0,0000398. Insbesondere ein Tagesbalken, der über dem Niveau von 0,0000395 schließt, zusammen mit einem Durchbruch über das EMA-200-Niveau, wird eine Aufwärtsdynamik des Paares ermöglichen, was dazu führen wird, dass DOGE gegenüber der ETH an Wert gewinnt.


 DeFi Planet
 Crypto Daily™
 BlockchainReporter
 TheCoinrise Media
 DogeHome
 Crypto Daily™
 Crypto Daily™
 TheCoinrise Media


