Dogecoin 분석: Dogecoin 시장에서 무슨 일이 일어나고 있나요?
The cryptocurrency market continues to recover from the effects of the decline that started with the opening of Wall Street. Bitcoin, which fell below the $35,000 level during the day, was trading at $35,043 at the time of writing this article. Of course, many altcoins were also negatively affected by this situation, but buying has started to increase in the altcoin market as well. So, what’s happening in the Dogecoin market? Let’s take a closer look.
Dogecoin Chart Analysis
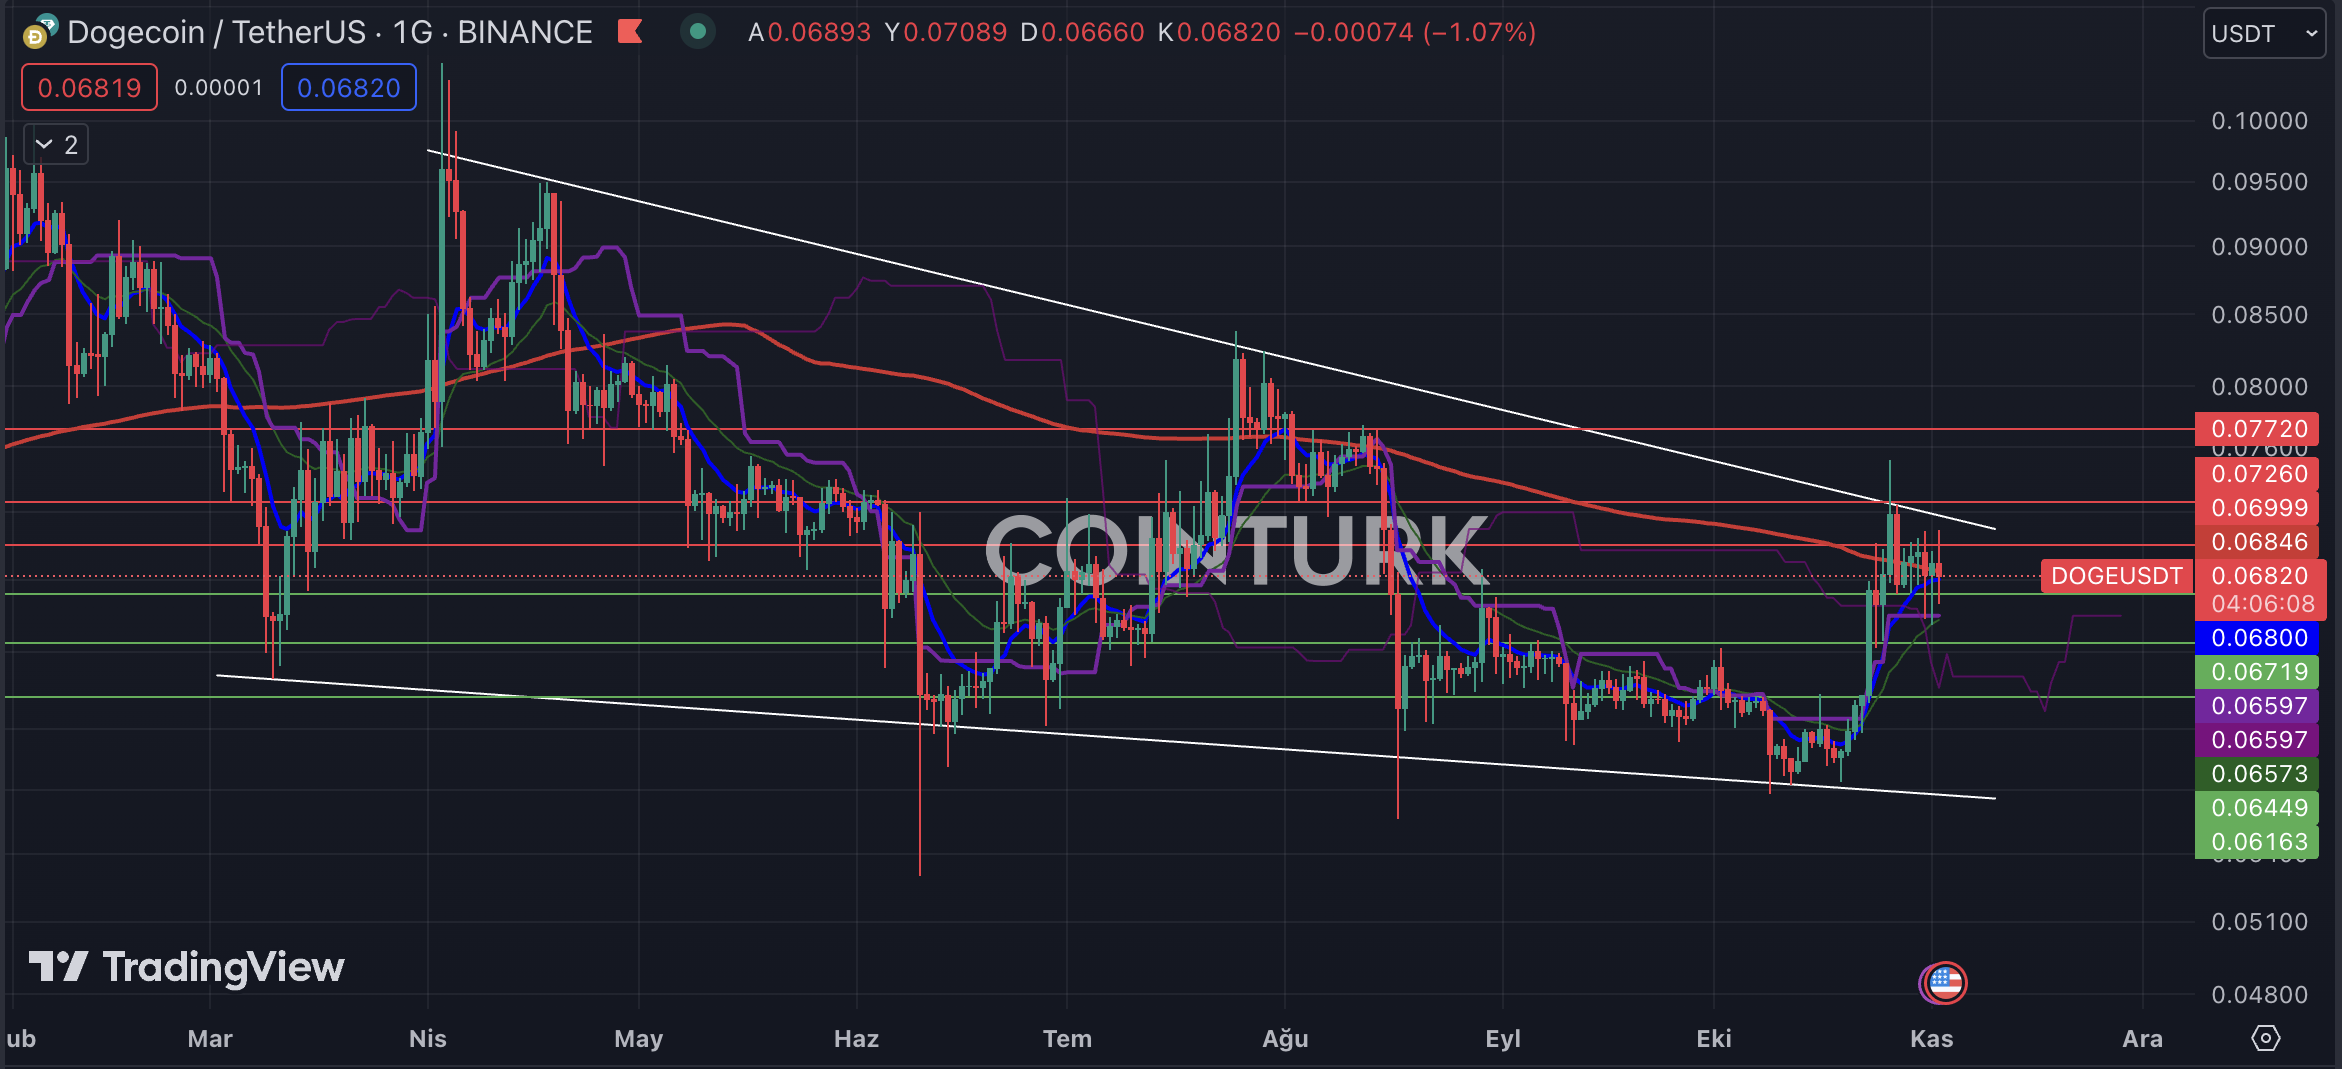
The first notable formation in the daily Dogecoin chart is a descending wedge formation. In this pattern that has been ongoing since March, the DOGE price recently squeezed into a tight range after touching the resistance line. This situation, especially at the EMA 200 (red line) level, may indicate a negative scenario for DOGE.
Dogecoin 차트 분석일일 Dogecoin 차트에서 첫 번째로 주목할만한 형태는 하강하는 쐐기 형태입니다. 3월부터 지속되는 이 패턴에서 DOGE 가격은 최근 저항선을 터치한 후 좁은 박스권에 진입했습니다. 특히 EMA 200(빨간색 선) 수준에서 이러한 상황은 DOGE에 부정적인 시나리오를 나타낼 수 있습니다.
The support levels to watch for DOGE are respectively $0.06719, $0.06449, and $0.06163. Although it may be difficult to talk about any negative scenarios below these supports, contact with the support line can be expected with a daily bar closing below the $0.06163 level.
The resistance levels to watch for DOGE are respectively $0.06820, $0.07260, and $0.07720. Especially, a daily bar closing above the $0.07260 level will trigger an upward breakout in the descending wedge formation and this will accelerate the rise of DOGE.
DOGE를 관찰할 저항 수준은 각각 $0.06820, $0.07260, $0.07720입니다. 특히 일일 막대가 $0.07260 수준 이상으로 마감되면 하강 쐐기형의 상승 돌파가 촉발되고 이는 DOGE의 상승을 가속화할 것입니다.

DOGE/ETH Chart Analysis
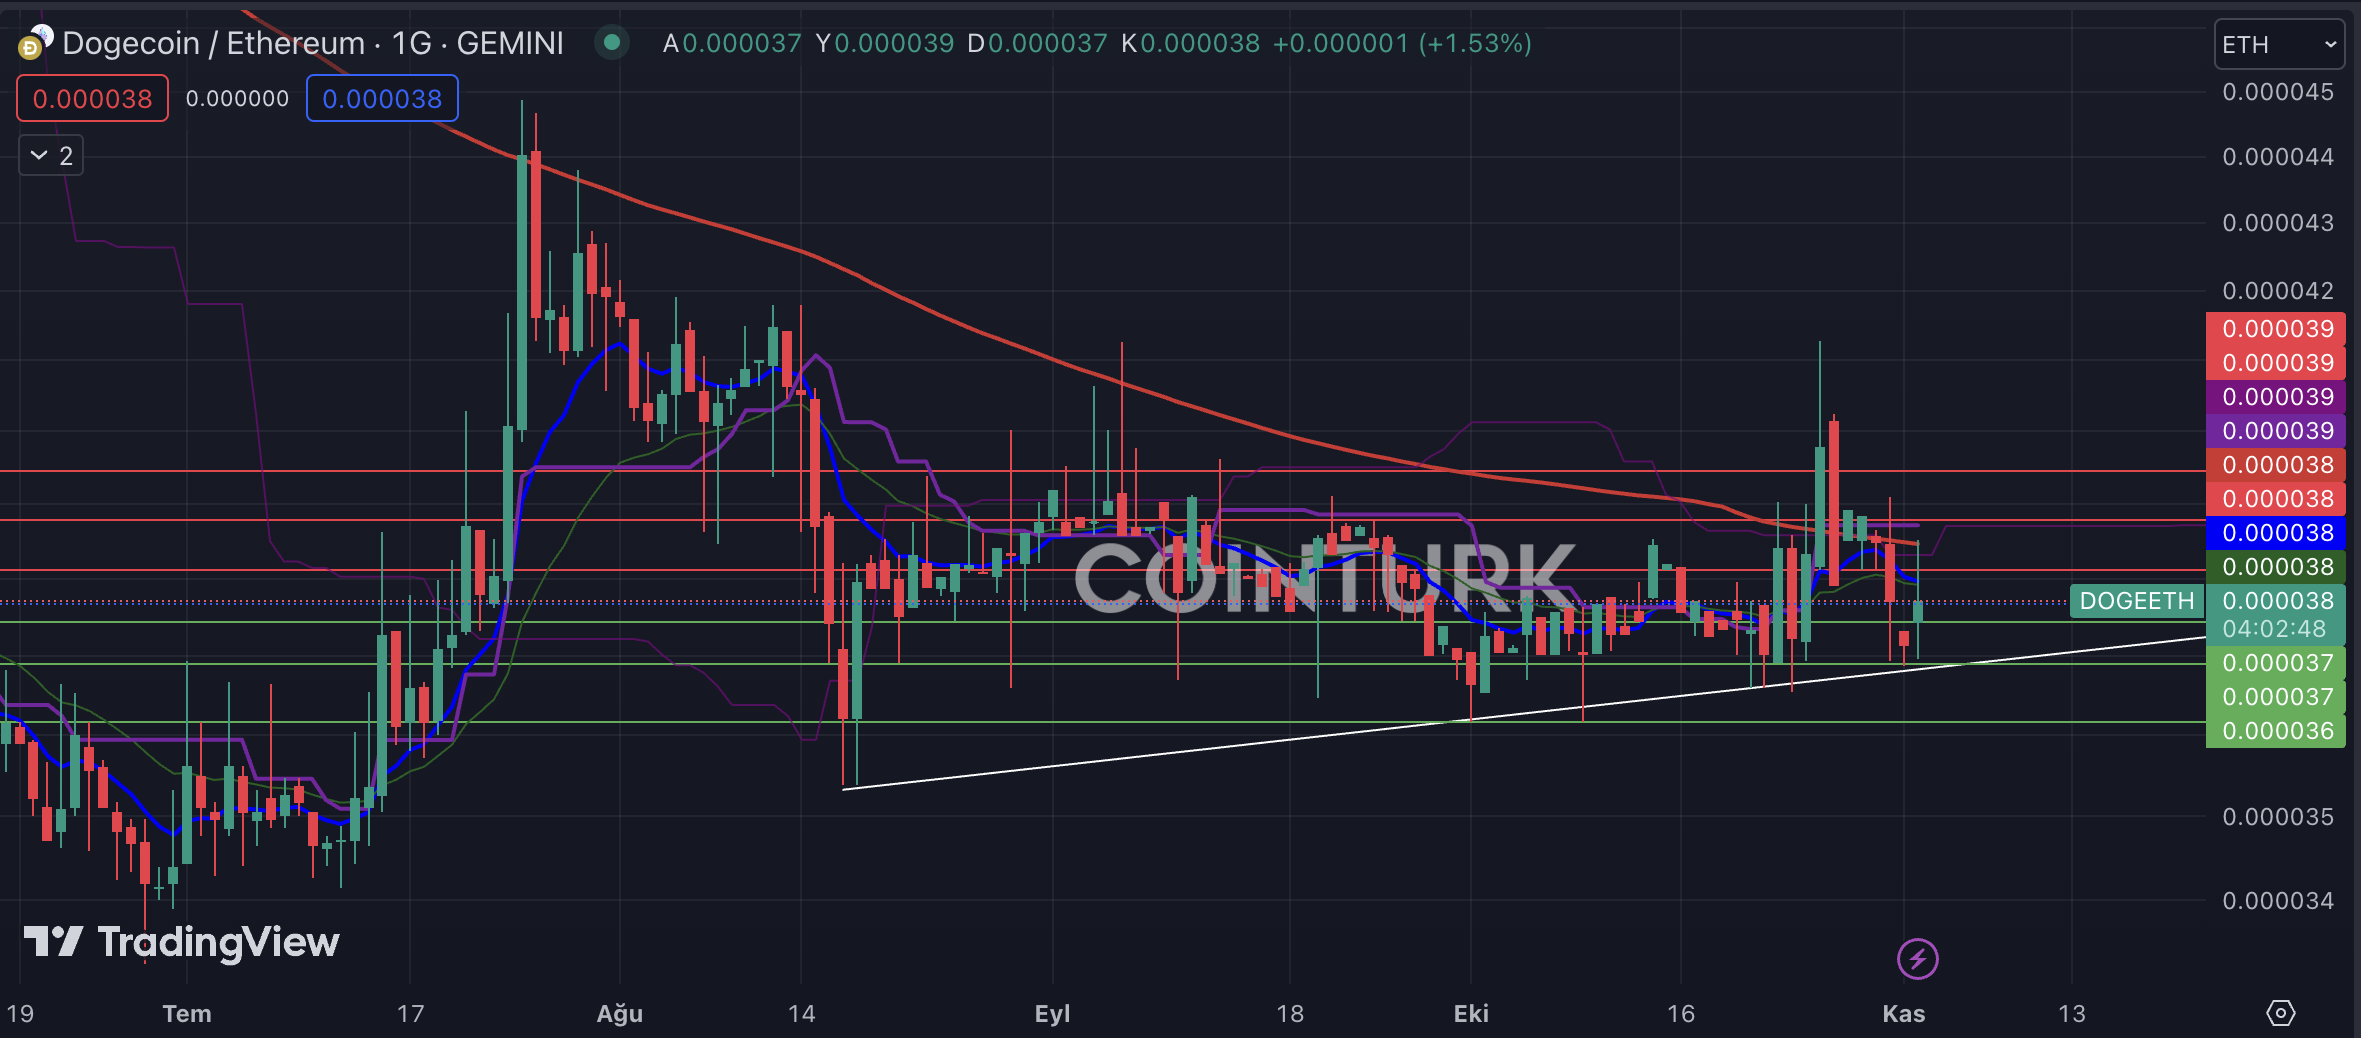
Another notable chart in the DOGE camp is the DOGE/ETH pair. The support trendline that has been in place since August indicates a significant power gain here, and accordingly, positive news flow in the near future could cause Dogecoin to gain value against Ethereum. Also, the recent resistance of the EMA 200 (red line) level is causing pressure on the pair.
The support levels to watch for the DOGE/ETH pair are respectively 0.0000375, 0.0000370, and 0.0000360. Especially, a daily bar closing below the 0.0000360 level can trigger a decline in the pair, causing Ethereum to gain value against DOGE.
The resistance levels to watch for the DOGE/ETH pair are respectively 0.0000390, 0.0000395, and 0.0000398. Especially, a daily bar closing above the 0.0000395 level, along with breaking above the EMA 200 level, will enable an upward momentum in the pair, causing DOGE to gain value against ETH.
DOGE/ETH 쌍을 관찰할 저항 수준은 각각 0.0000390, 0.0000395 및 0.0000398입니다. 특히 일일 막대가 0.0000395 수준 이상으로 마감되고 EMA 200 수준을 돌파하면 쌍의 상승 모멘텀이 활성화되어 DOGE가 ETH 대비 가치를 얻게 됩니다.


 The Bit Journal
 Times Tabloid
 CoinoMedia
 U_Today
 ETHNews
 crypto.news
 CoinPedia News
 CoinoMedia
 Optimisus


