ドージコイン分析: ドージコイン市場で何が起こっているのか?
The cryptocurrency market continues to recover from the effects of the decline that started with the opening of Wall Street. Bitcoin, which fell below the $35,000 level during the day, was trading at $35,043 at the time of writing this article. Of course, many altcoins were also negatively affected by this situation, but buying has started to increase in the altcoin market as well. So, what’s happening in the Dogecoin market? Let’s take a closer look.
仮想通貨市場は、ウォール街の開放で始まった下落の影響から回復を続けています。日中に35,000ドルの水準を下回ったビットコインは、この記事の執筆時点では35,043ドルで取引されていました。もちろん、多くのアルトコインもこの状況により悪影響を受けましたが、アルトコイン市場でも買いが増え始めています。では、ドージコイン市場で何が起こっているのでしょうか?詳しく見てみましょう。
Dogecoin Chart Analysis
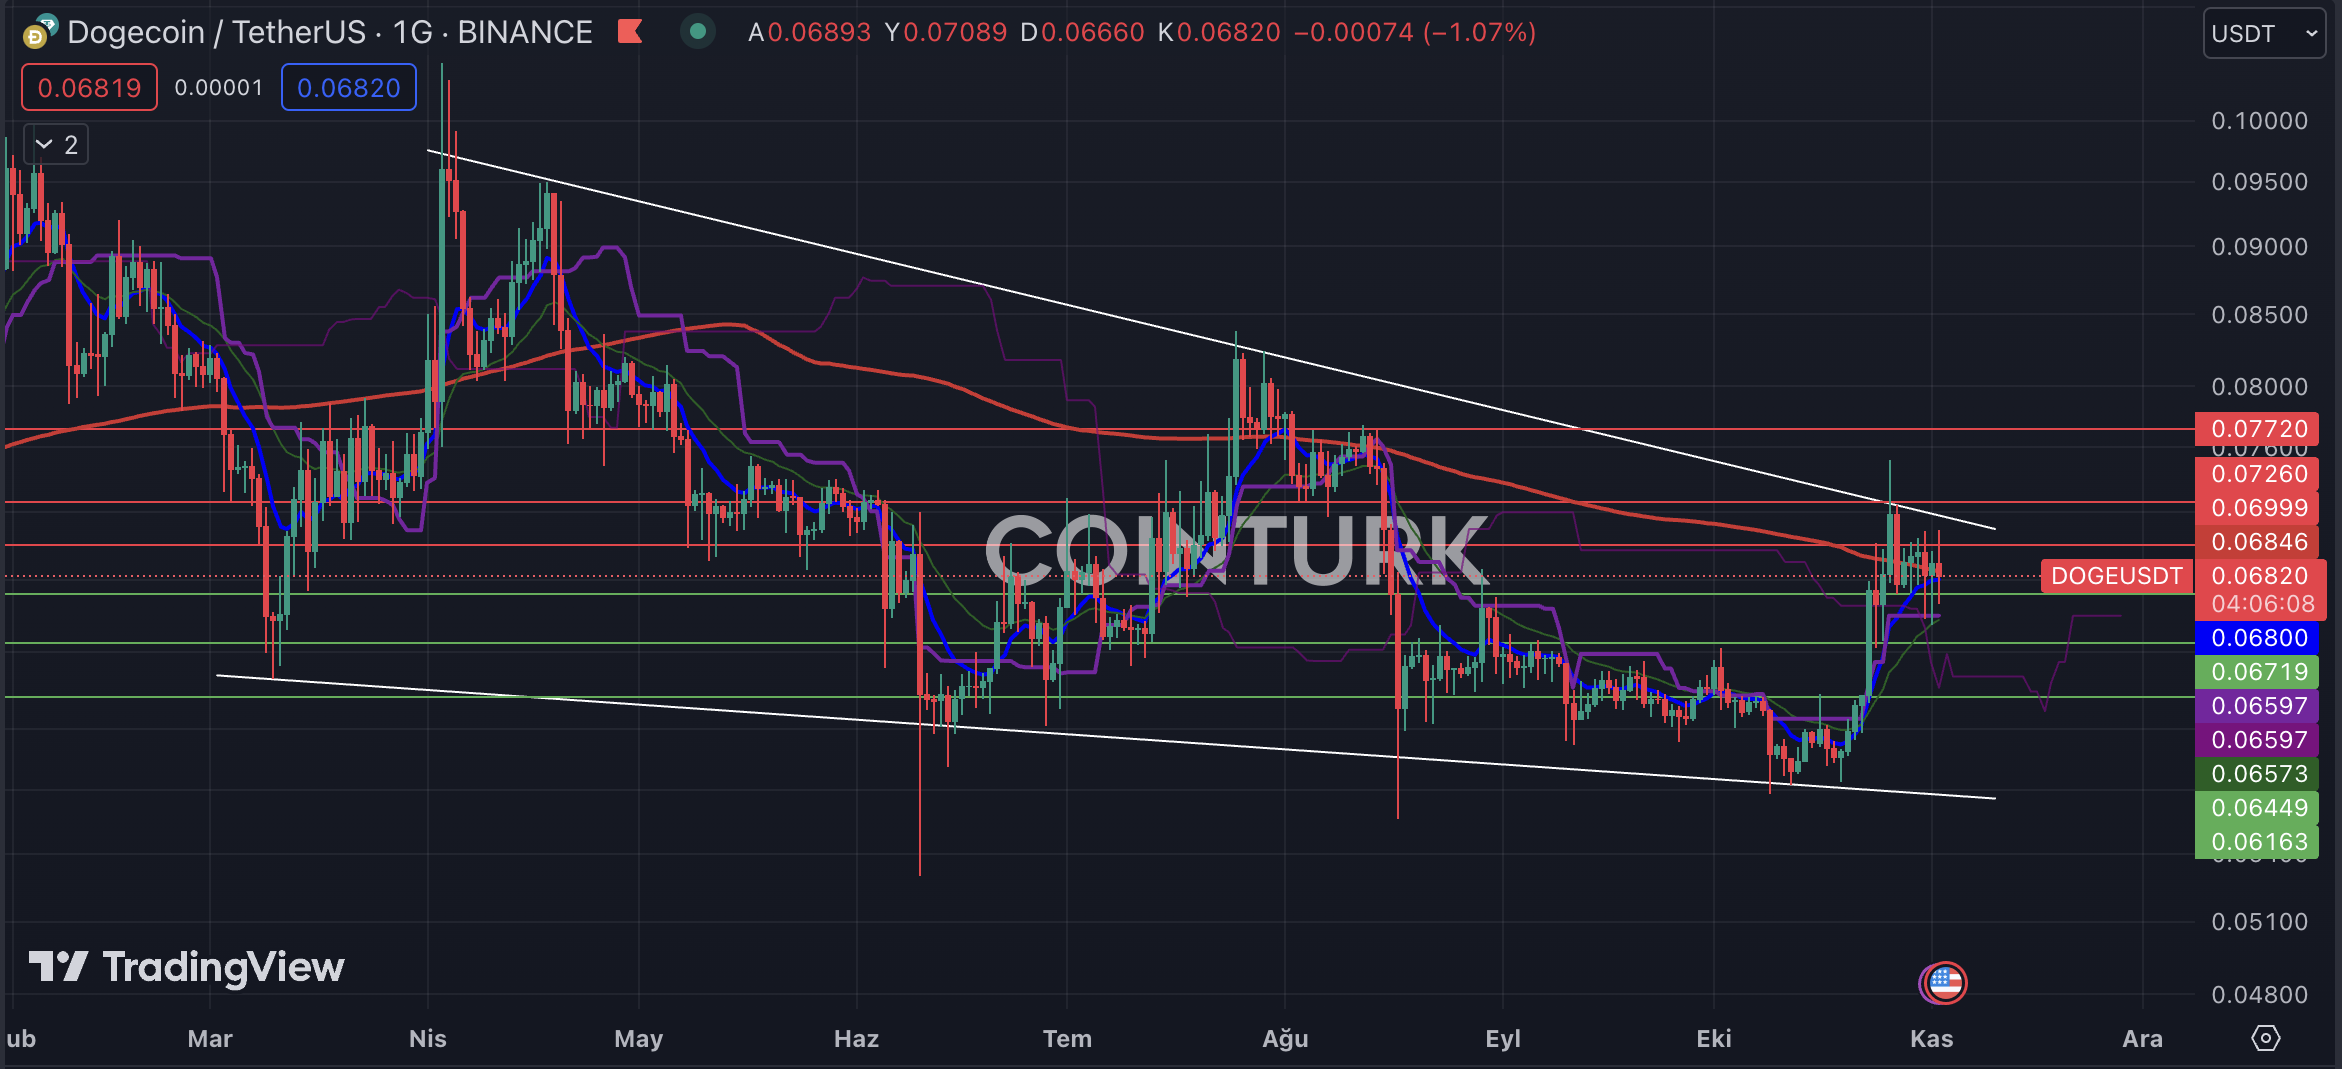
The first notable formation in the daily Dogecoin chart is a descending wedge formation. In this pattern that has been ongoing since March, the DOGE price recently squeezed into a tight range after touching the resistance line. This situation, especially at the EMA 200 (red line) level, may indicate a negative scenario for DOGE.
ドージコイン チャート分析ドージコインの日足チャートの最初の注目すべきフォーメーションは、下降ウェッジ フォーメーションです。 3月以来続いているこのパターンでは、DOGE価格は最近、レジスタンスラインに触れた後、狭いレンジに押し込まれています。この状況、特に EMA 200 (赤い線) レベルでは、DOGE にとってマイナスのシナリオが示されている可能性があります。
The support levels to watch for DOGE are respectively $0.06719, $0.06449, and $0.06163. Although it may be difficult to talk about any negative scenarios below these supports, contact with the support line can be expected with a daily bar closing below the $0.06163 level.
DOGEの注目すべきサポートレベルはそれぞれ0.06719ドル、0.06449ドル、0.06163ドルです。これらのサポートを下回るネガティブなシナリオについて話すのは難しいかもしれませんが、日足が0.06163ドルのレベルを下回って終了するとサポートラインとの接触が予想されます。
The resistance levels to watch for DOGE are respectively $0.06820, $0.07260, and $0.07720. Especially, a daily bar closing above the $0.07260 level will trigger an upward breakout in the descending wedge formation and this will accelerate the rise of DOGE.
DOGEで注目すべき抵抗レベルはそれぞれ0.06820ドル、0.07260ドル、0.07720ドルです。特に、日足が0.07260ドルのレベルを超えて終了すると、下降ウェッジフォーメーションの上方ブレイクアウトが引き起こされ、DOGEの上昇が加速することになる。

DOGE/ETH Chart Analysis
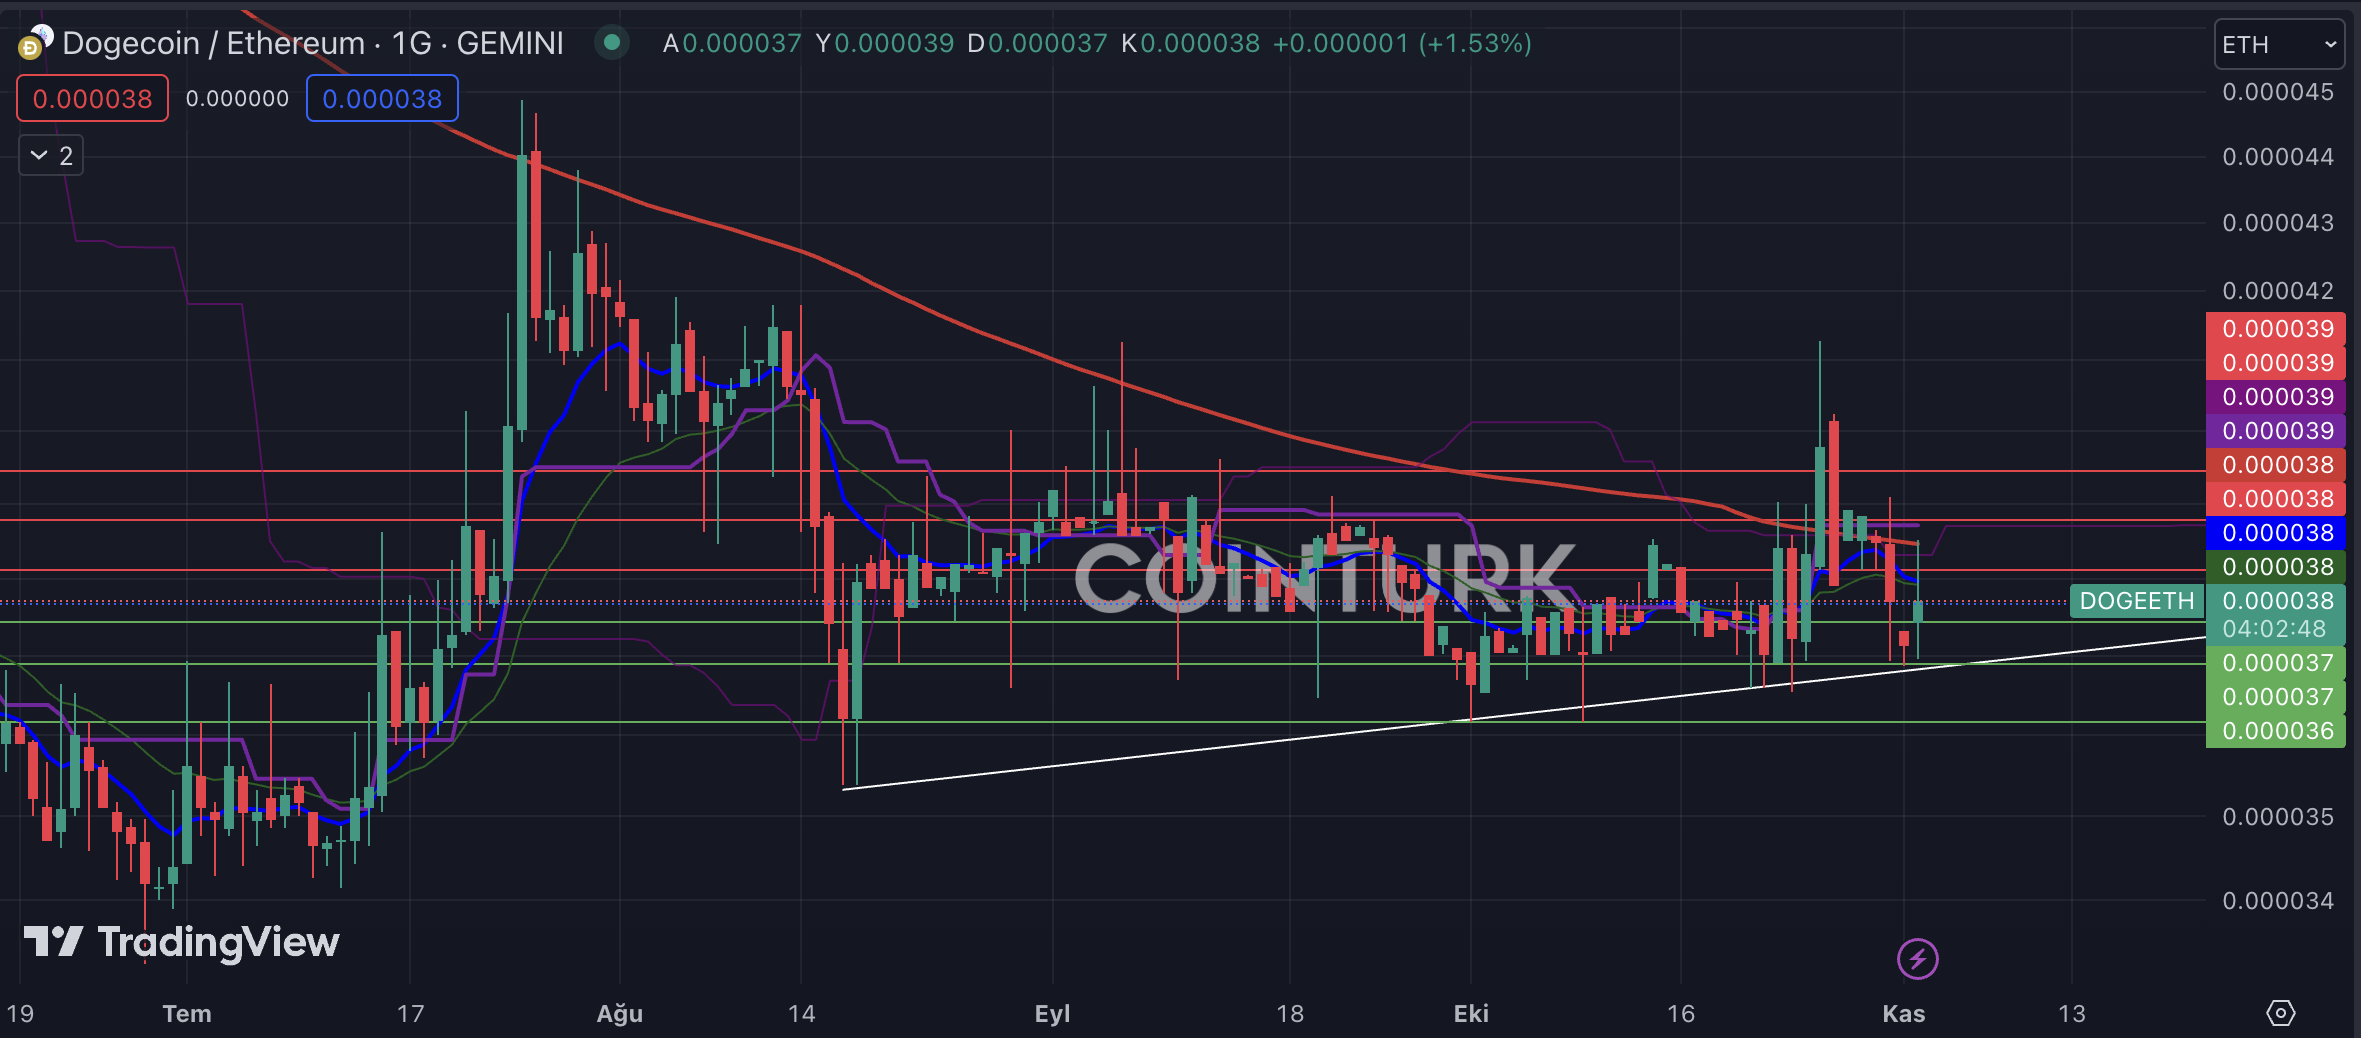
Another notable chart in the DOGE camp is the DOGE/ETH pair. The support trendline that has been in place since August indicates a significant power gain here, and accordingly, positive news flow in the near future could cause Dogecoin to gain value against Ethereum. Also, the recent resistance of the EMA 200 (red line) level is causing pressure on the pair.
DOGE/ETH チャート分析 DOGE 陣営のもう 1 つの注目すべきチャートは、DOGE/ETH ペアです。 8月から設定されているサポートトレンドラインは、ここでの大幅なパワーゲインを示しており、したがって、近い将来にポジティブなニュースの流れがドージコインのイーサリアムに対する価値を高める可能性があります。また、EMA 200 (赤い線) レベルの最近の抵抗がペアにプレッシャーを与えています。
The support levels to watch for the DOGE/ETH pair are respectively 0.0000375, 0.0000370, and 0.0000360. Especially, a daily bar closing below the 0.0000360 level can trigger a decline in the pair, causing Ethereum to gain value against DOGE.
DOGE/ETH ペアで注目すべきサポート レベルは、それぞれ 0.0000375、0.0000370、および 0.0000360 です。特に、日足が0.0000360レベルを下回って終了すると、ペアの下落が引き起こされ、DOGEに対してイーサリアムの価値が上昇する可能性があります。
The resistance levels to watch for the DOGE/ETH pair are respectively 0.0000390, 0.0000395, and 0.0000398. Especially, a daily bar closing above the 0.0000395 level, along with breaking above the EMA 200 level, will enable an upward momentum in the pair, causing DOGE to gain value against ETH.
DOGE/ETHペアで注目すべき抵抗レベルはそれぞれ0.0000390、0.0000395、0.0000398です。特に、日足が0.0000395レベルを超えて終了し、EMA 200レベルを突破すると、ペアの上昇の勢いが可能になり、DOGEがETHに対して価値を得る原因になります。


 Crypto Daily™
 BlockchainReporter
 TheCoinrise Media
 DogeHome
 Crypto Daily™
 Crypto Daily™
 TheCoinrise Media
 Thecoinrepublic.com


