Technical analysis is a crucial indicator that investors trading in the futures market, especially, need to continuously follow in the cryptocurrency market. So, what does technical analysis tell us about Dogecoin, which is currently trading at $0.07548? Let’s examine the detailed chart analysis along with the important support and resistance levels.
Die technische Analyse ist ein entscheidender Indikator dafür, dass insbesondere Anleger, die auf dem Terminmarkt handeln, den Kryptowährungsmarkt kontinuierlich verfolgen müssen. Was sagt uns die technische Analyse also über Dogecoin, der derzeit bei 0,07548 US-Dollar gehandelt wird? Schauen wir uns die detaillierte Diagrammanalyse zusammen mit den wichtigen Unterstützungs- und Widerstandsniveaus an.
Four-Hour Chart Analysis of Dogecoin
Vier-Stunden-Chartanalyse von Dogecoin
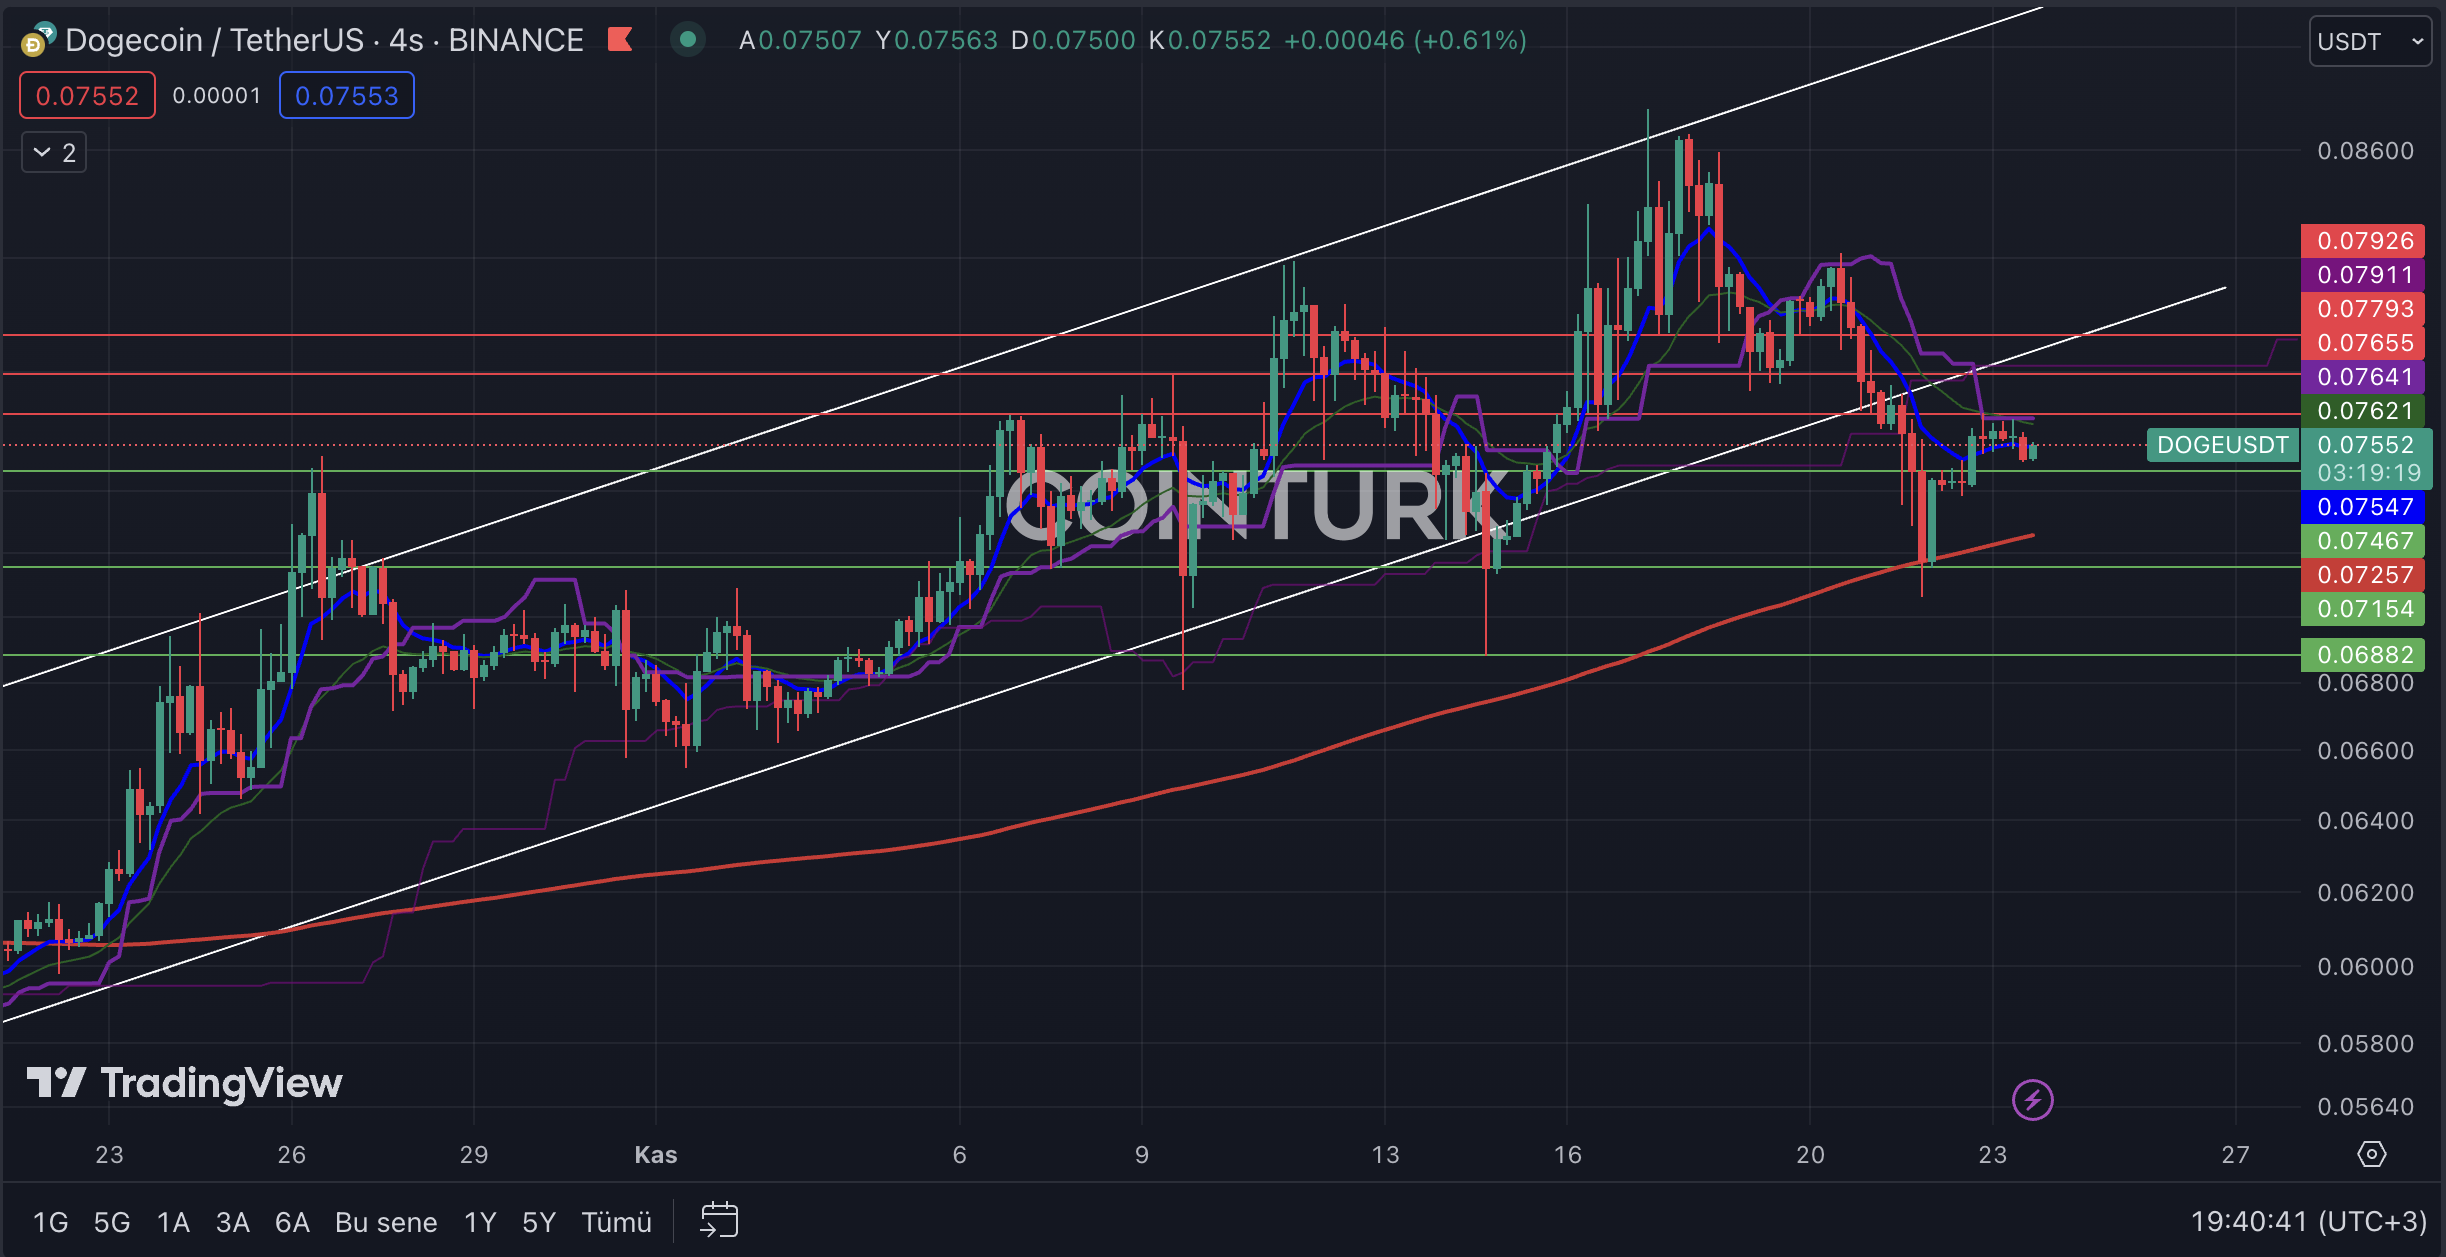
The four-hour chart analysis for Dogecoin shows a continuing anxious wait. According to this, DOGE, which experienced a support break after the correction that occurred on November 21 in the rising channel formation, has not yet entered the formation zone, despite completing its correction movement after finding support at the EMA 200 (red line) level. This situation is particularly important for short-term investors trading in the futures market.
Die vierstündige Chartanalyse für Dogecoin zeigt ein anhaltendes ängstliches Warten. Demnach hat DOGE, das nach der Korrektur am 21. November in der aufsteigenden Kanalformation einen Unterstützungsbruch erlebte, die Formationszone noch nicht betreten, obwohl es seine Korrekturbewegung abgeschlossen hat, nachdem es Unterstützung auf dem EMA 200-Niveau (rote Linie) gefunden hatte . Diese Situation ist besonders wichtig für kurzfristige Anleger, die auf dem Terminmarkt handeln.
The most important support levels to be followed for Dogecoin are respectively; $0.07467, $0.07154, and $0.06882. Especially for DOGE, which is trapped in a narrow range, if the four-hour bar closes below the $0.07467 level, it will cause the price to lose momentum again. After this process, the bar closure below the $0.07154 level, which intersects with the EMA 200 level, is the most important level that investors need to pay attention to.
Die wichtigsten Unterstützungsstufen für Dogecoin sind jeweils: 0,07467 $, 0,07154 $ und 0,06882 $. Insbesondere für DOGE, das in einer engen Spanne gefangen ist: Wenn der Vier-Stunden-Balken unter dem Niveau von 0,07467 $ schließt, wird der Preis wieder an Schwung verlieren. Nach diesem Prozess ist der Schlusskurs unterhalb der 0,07154-Dollar-Marke, die sich mit der EMA-200-Marke schneidet, die wichtigste Marke, auf die Anleger achten müssen.
The most important resistance levels to be considered in the four-hour chart for Dogecoin are respectively; $0.07655, $0.07793, and $0.07926. Especially, if the four-hour bar closes above the $0.07793 level, it will help DOGE re-enter the formation zone and gain momentum.
Die wichtigsten Widerstandsniveaus, die im Vier-Stunden-Chart für Dogecoin berücksichtigt werden müssen, sind: 0,07655 $, 0,07793 $ und 0,07926 $. Insbesondere wenn der Vier-Stunden-Balken über dem Niveau von 0,07793 $ schließt, wird dies DOGE dabei helfen, wieder in die Formationszone einzudringen und an Dynamik zu gewinnen.

Weekly Chart Analysis of Dogecoin
Wöchentliche Chartanalyse von Dogecoin
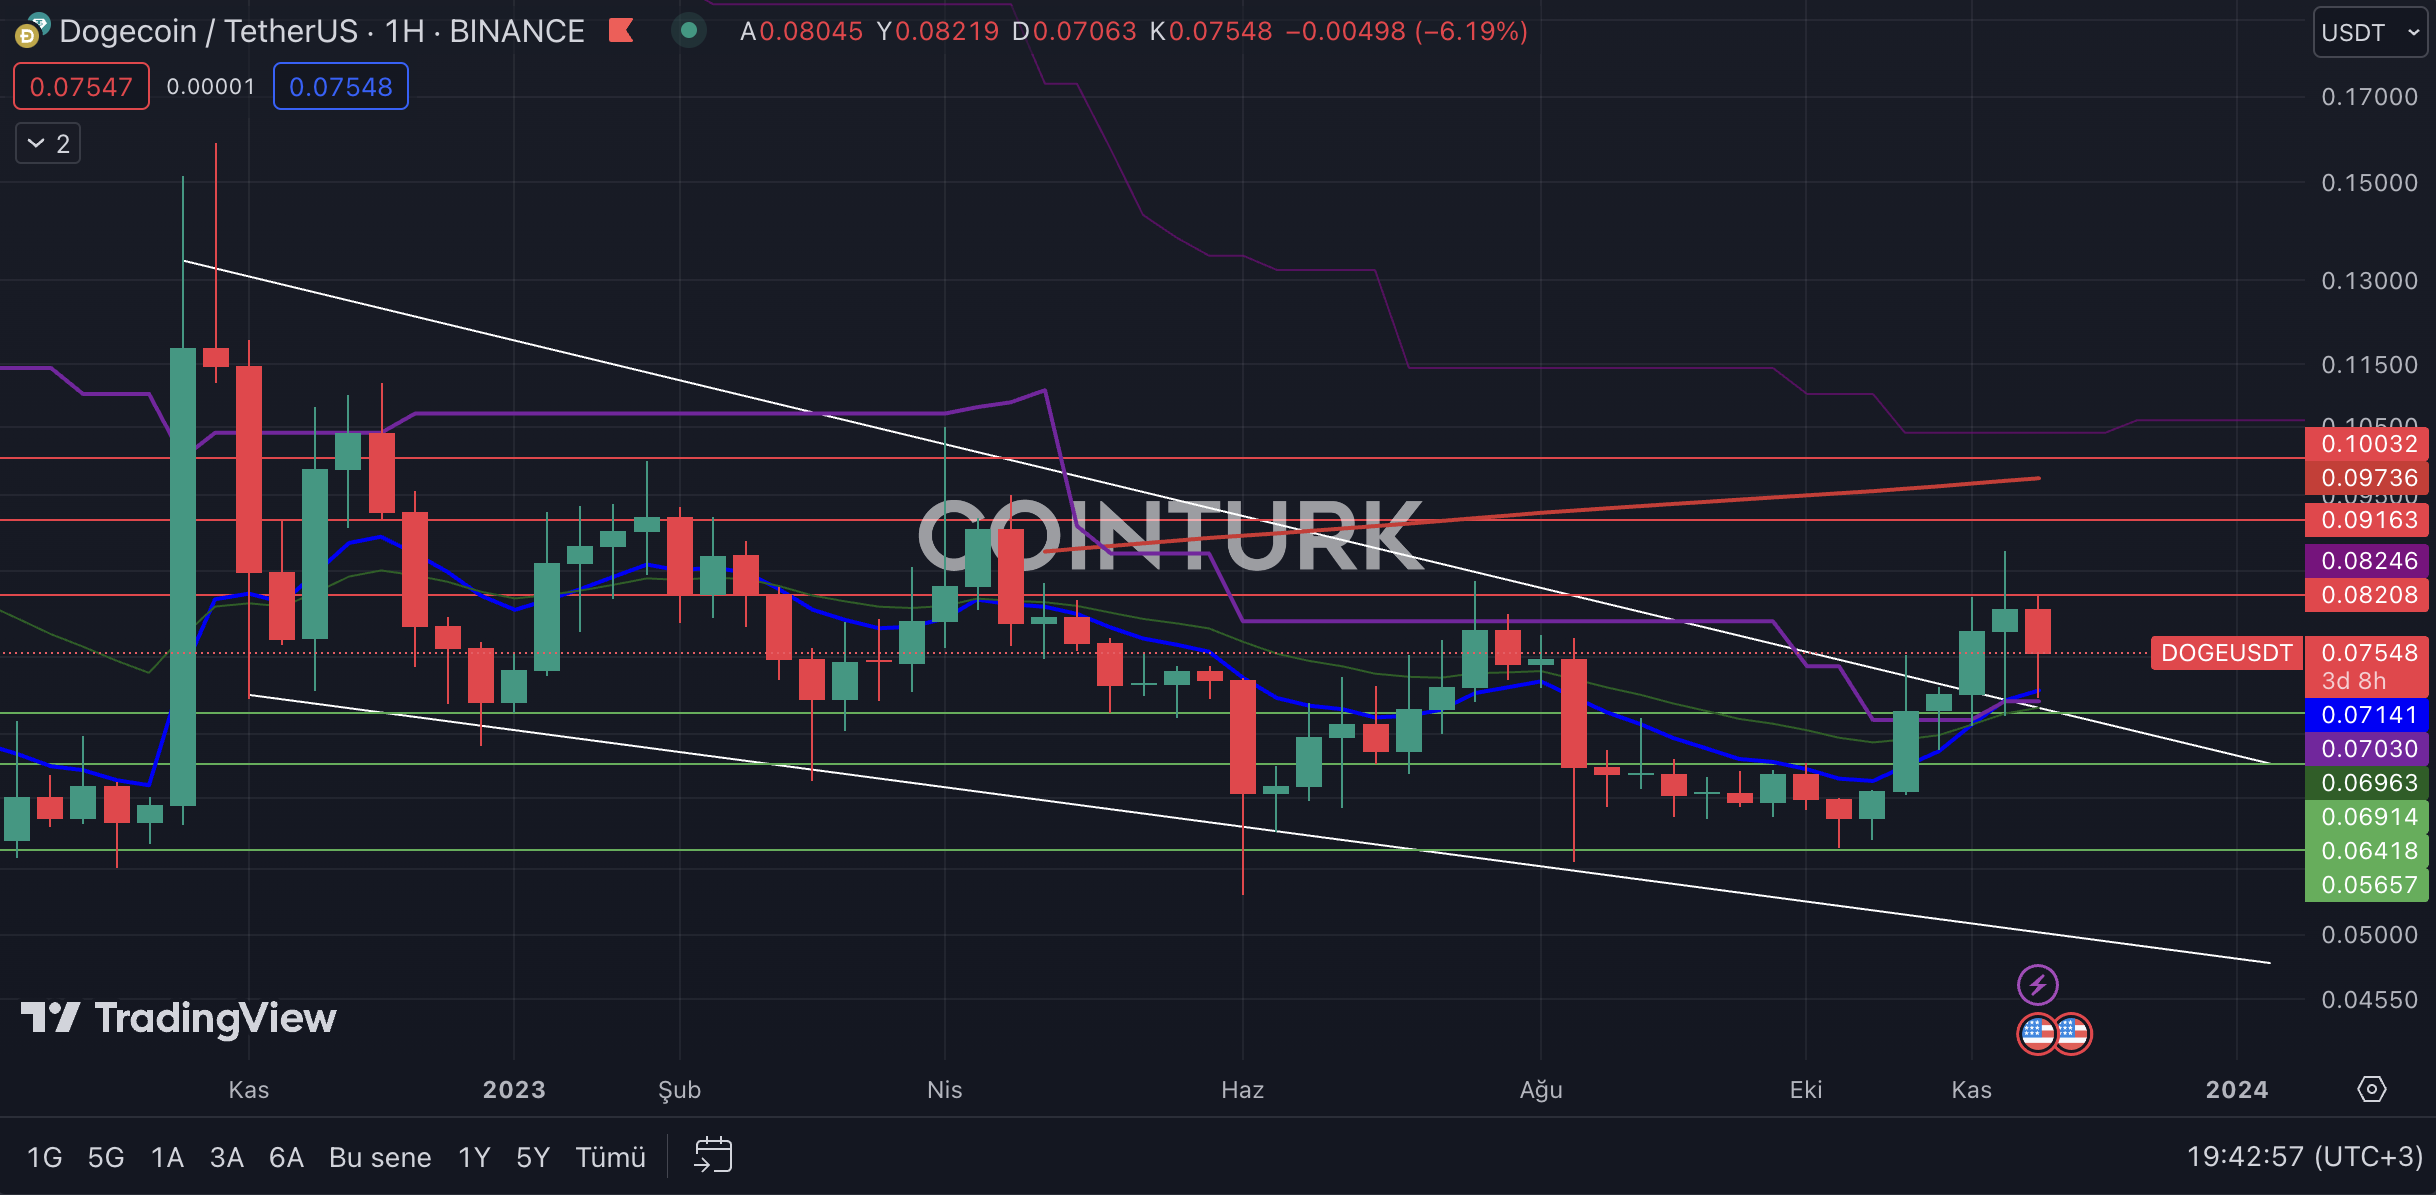
In the weekly chart analysis of Dogecoin, there is a narrowing channel formation that has been developing since November 2022. With the recent uptrend, DOGE managed to break the resistance line in this formation structure, and we saw that the resistance line worked as support during the correction that occurred this week. Such breakouts successfully attract the attention of investors in both the cryptocurrency market and traditional markets in terms of technical analysis.
In der wöchentlichen Chartanalyse von Dogecoin gibt es eine sich verengende Kanalformation, die sich seit November 2022 entwickelt. Mit dem jüngsten Aufwärtstrend gelang es DOGE, die Widerstandslinie in dieser Formationsstruktur zu durchbrechen, und wir sahen, dass die Widerstandslinie währenddessen als Unterstützung fungierte die Korrektur, die diese Woche stattgefunden hat. Solche Ausbrüche ziehen im Hinblick auf die technische Analyse erfolgreich die Aufmerksamkeit von Anlegern sowohl auf dem Kryptowährungsmarkt als auch auf traditionellen Märkten auf sich.
The most important support levels to be followed in the weekly chart for DOGE are respectively; $0.06914, $0.06418, and $0.05657. Especially, if the weekly bar closes below the $0.06914 level, it will cause the DOGE price to lose momentum.
Die wichtigsten Unterstützungsniveaus, die im Wochen-Chart für DOGE verfolgt werden sollten, sind jeweils; 0,06914 $, 0,06418 $ und 0,05657 $. Insbesondere wenn der Wochenbalken unter dem Niveau von 0,06914 $ schließt, verliert der DOGE-Preis an Dynamik.
The most important resistance levels to be considered in the weekly chart for DOGE are respectively; $0.08208, $0.09163, and $0.10032. Especially, if the weekly bar closes above the $0.10032 level, it will lead to the breakage of the EMA 200 level and the price gaining momentum.
Die wichtigsten Widerstandsniveaus, die im Wochen-Chart für DOGE berücksichtigt werden müssen, sind: 0,08208 $, 0,09163 $ und 0,10032 $. Insbesondere wenn der wöchentliche Balken über dem Niveau von 0,10032 $ schließt, wird dies zum Durchbruch des EMA-200-Niveaus führen und der Preis gewinnt an Dynamik.

Weiterlesen: https://en.coin-turk.com/technical-analysis-of-dogecoin-important-support-and-resistance-levels/


 Cryptopolitan_News
 Optimisus
 Crypto News Land
 DogeHome
 Crypto News Flash
 CoinsProbe
 CFN
CFN Cryptos Newss


