Technical analysis is a crucial indicator that investors trading in the futures market, especially, need to continuously follow in the cryptocurrency market. So, what does technical analysis tell us about Dogecoin, which is currently trading at $0.07548? Let’s examine the detailed chart analysis along with the important support and resistance levels.
技术分析是投资者在期货市场交易尤其是在加密货币市场需要持续关注的重要指标。那么,对于目前交易价格为 0.07548 美元的狗狗币,技术分析告诉我们什么?让我们来看看详细的图表分析以及重要的支撑位和阻力位。
Four-Hour Chart Analysis of Dogecoin
狗狗币四小时图分析
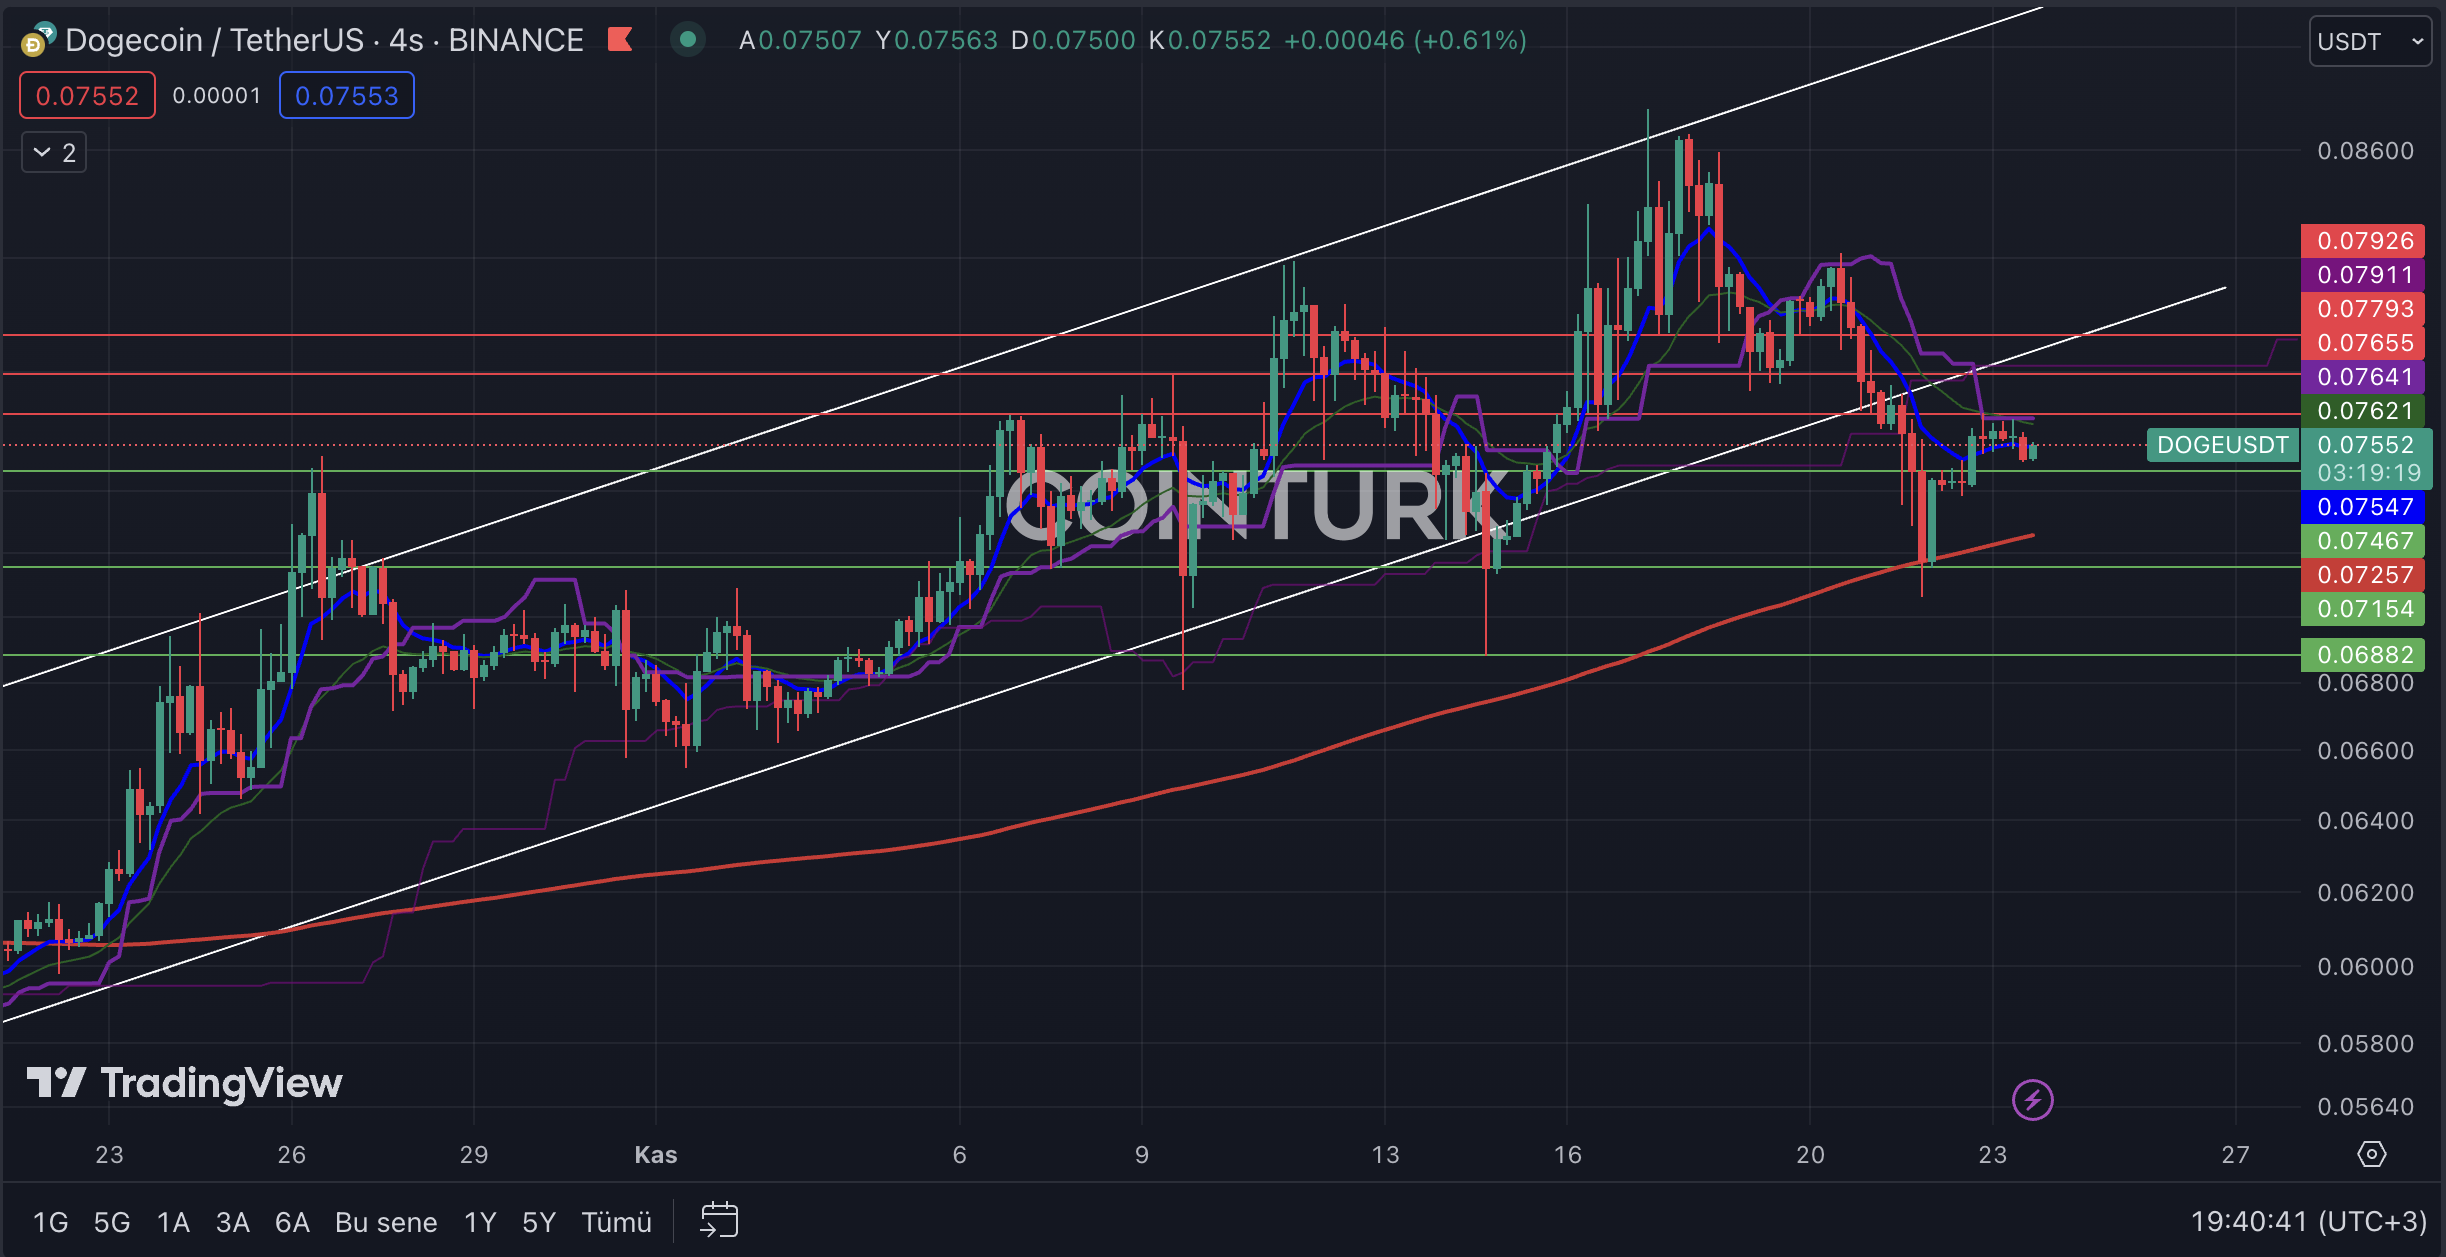
The four-hour chart analysis for Dogecoin shows a continuing anxious wait. According to this, DOGE, which experienced a support break after the correction that occurred on November 21 in the rising channel formation, has not yet entered the formation zone, despite completing its correction movement after finding support at the EMA 200 (red line) level. This situation is particularly important for short-term investors trading in the futures market.
狗狗币的四小时图表分析显示了持续的焦急等待。据此,DOGE在11月21日上升通道形成修正后经历了支撑位突破,但尚未进入形成区域,尽管在EMA 200(红线)水平找到支撑后完成了修正运动。这种情况对于在期货市场交易的短线投资者来说尤为重要。
The most important support levels to be followed for Dogecoin are respectively; $0.07467, $0.07154, and $0.06882. Especially for DOGE, which is trapped in a narrow range, if the four-hour bar closes below the $0.07467 level, it will cause the price to lose momentum again. After this process, the bar closure below the $0.07154 level, which intersects with the EMA 200 level, is the most important level that investors need to pay attention to.
狗狗币最重要的支撑位分别是: 0.07467 美元、0.07154 美元和 0.06882 美元。尤其是对于陷入窄幅震荡的DOGE来说,如果四小时柱线收于0.07467美元水平以下,将导致价格再次失去动能。在此过程之后,收盘价低于 0.07154 美元水平(与 EMA 200 水平相交)是投资者需要关注的最重要水平。
The most important resistance levels to be considered in the four-hour chart for Dogecoin are respectively; $0.07655, $0.07793, and $0.07926. Especially, if the four-hour bar closes above the $0.07793 level, it will help DOGE re-enter the formation zone and gain momentum.
狗狗币四小时图表中要考虑的最重要的阻力位分别是: 0.07655 美元、0.07793 美元和 0.07926 美元。特别是,如果四小时柱线收于 0.07793 美元上方,将有助于 DOGE 重新进入形成区域并获得动力。

Weekly Chart Analysis of Dogecoin
狗狗币周线图分析
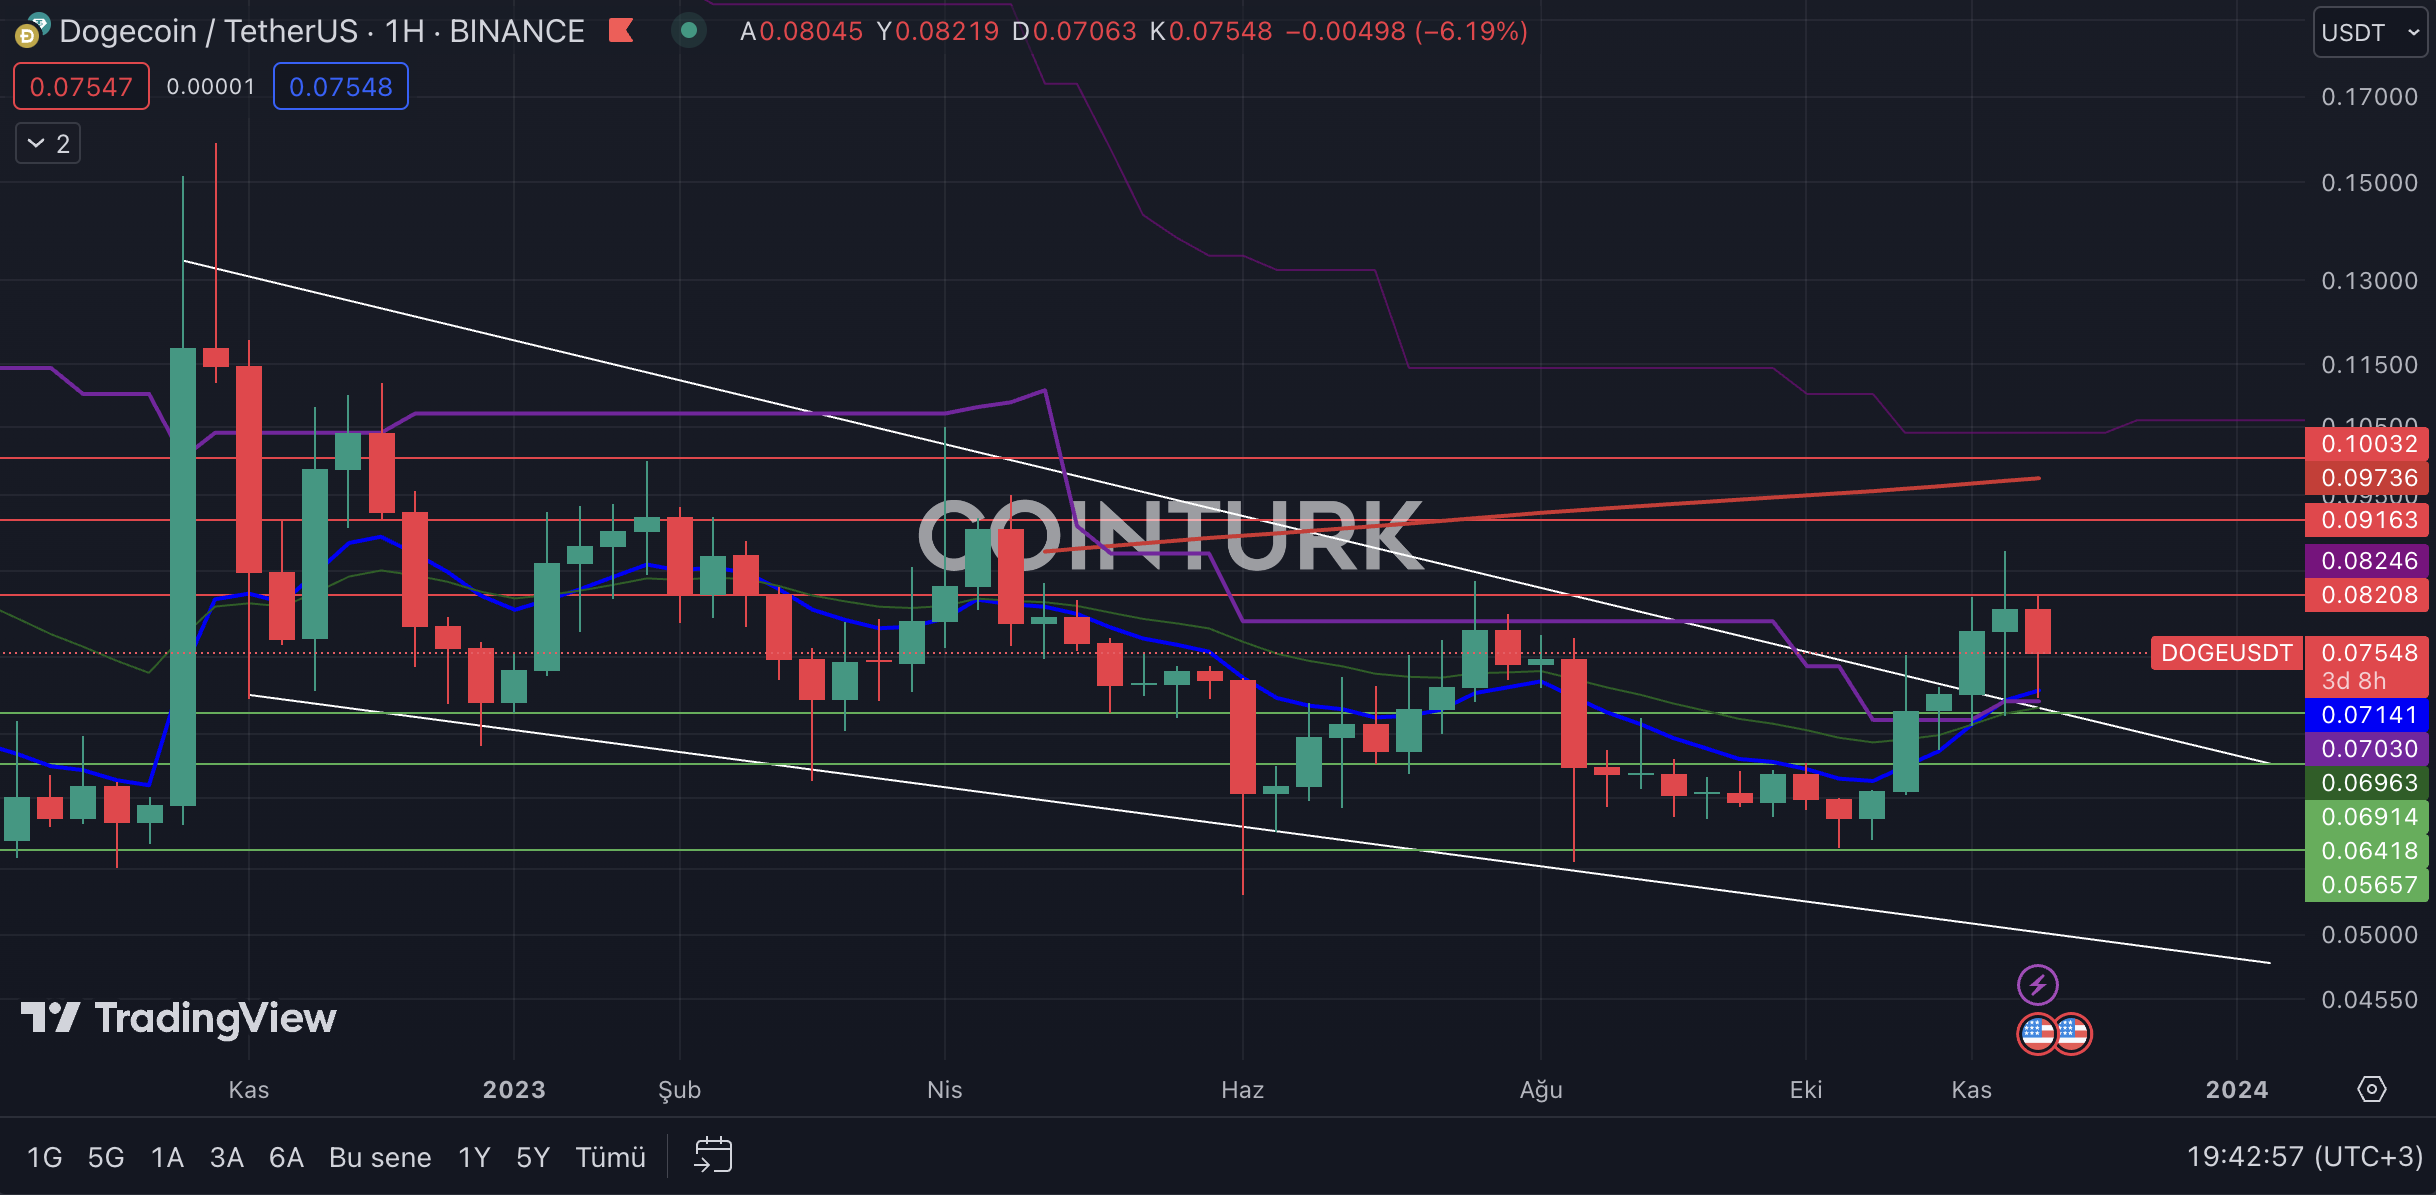
In the weekly chart analysis of Dogecoin, there is a narrowing channel formation that has been developing since November 2022. With the recent uptrend, DOGE managed to break the resistance line in this formation structure, and we saw that the resistance line worked as support during the correction that occurred this week. Such breakouts successfully attract the attention of investors in both the cryptocurrency market and traditional markets in terms of technical analysis.
在狗狗币的周线图分析中,有一个自 2022 年 11 月以来一直在发展的收窄通道形态。随着近期的上涨趋势,狗狗币成功突破了该形态结构中的阻力线,我们看到阻力线在本周发生的修正。这样的突破在技术分析方面成功吸引了加密货币市场和传统市场投资者的关注。
The most important support levels to be followed in the weekly chart for DOGE are respectively; $0.06914, $0.06418, and $0.05657. Especially, if the weekly bar closes below the $0.06914 level, it will cause the DOGE price to lose momentum.
DOGE 周线图中最重要的支撑位分别是: 0.06914 美元、0.06418 美元和 0.05657 美元。特别是,如果周线收盘价低于 0.06914 美元水平,将导致 DOGE 价格失去动力。
The most important resistance levels to be considered in the weekly chart for DOGE are respectively; $0.08208, $0.09163, and $0.10032. Especially, if the weekly bar closes above the $0.10032 level, it will lead to the breakage of the EMA 200 level and the price gaining momentum.
DOGE 周线图中要考虑的最重要阻力位分别是: 0.08208 美元、0.09163 美元和 0.10032 美元。特别是,如果周线收于 0.10032 美元上方,将导致 EMA 200 水平突破,价格获得动力。

继续阅读:https://en.coin-turk.com/technical-analysis-of-dogecoin-important-support-and-resistance-levels/


 crypto.ro English
 DogeHome
 Crypto News Land
 ETHNews
 CFN
CFN U_Today
 Thecoinrepublic.com
 Optimisus


