Technical analysis is a crucial indicator that investors trading in the futures market, especially, need to continuously follow in the cryptocurrency market. So, what does technical analysis tell us about Dogecoin, which is currently trading at $0.07548? Let’s examine the detailed chart analysis along with the important support and resistance levels.
기술적 분석은 선물시장에서 거래하는 투자자, 특히 암호화폐 시장에서 지속적으로 관찰해야 할 중요한 지표입니다. 그렇다면 현재 0.07548달러에 거래되고 있는 Dogecoin에 대해 기술적 분석을 통해 우리는 무엇을 알 수 있을까요? 중요한 지지 및 저항 수준과 함께 자세한 차트 분석을 살펴보겠습니다.
Four-Hour Chart Analysis of Dogecoin
Dogecoin의 4시간 차트 분석
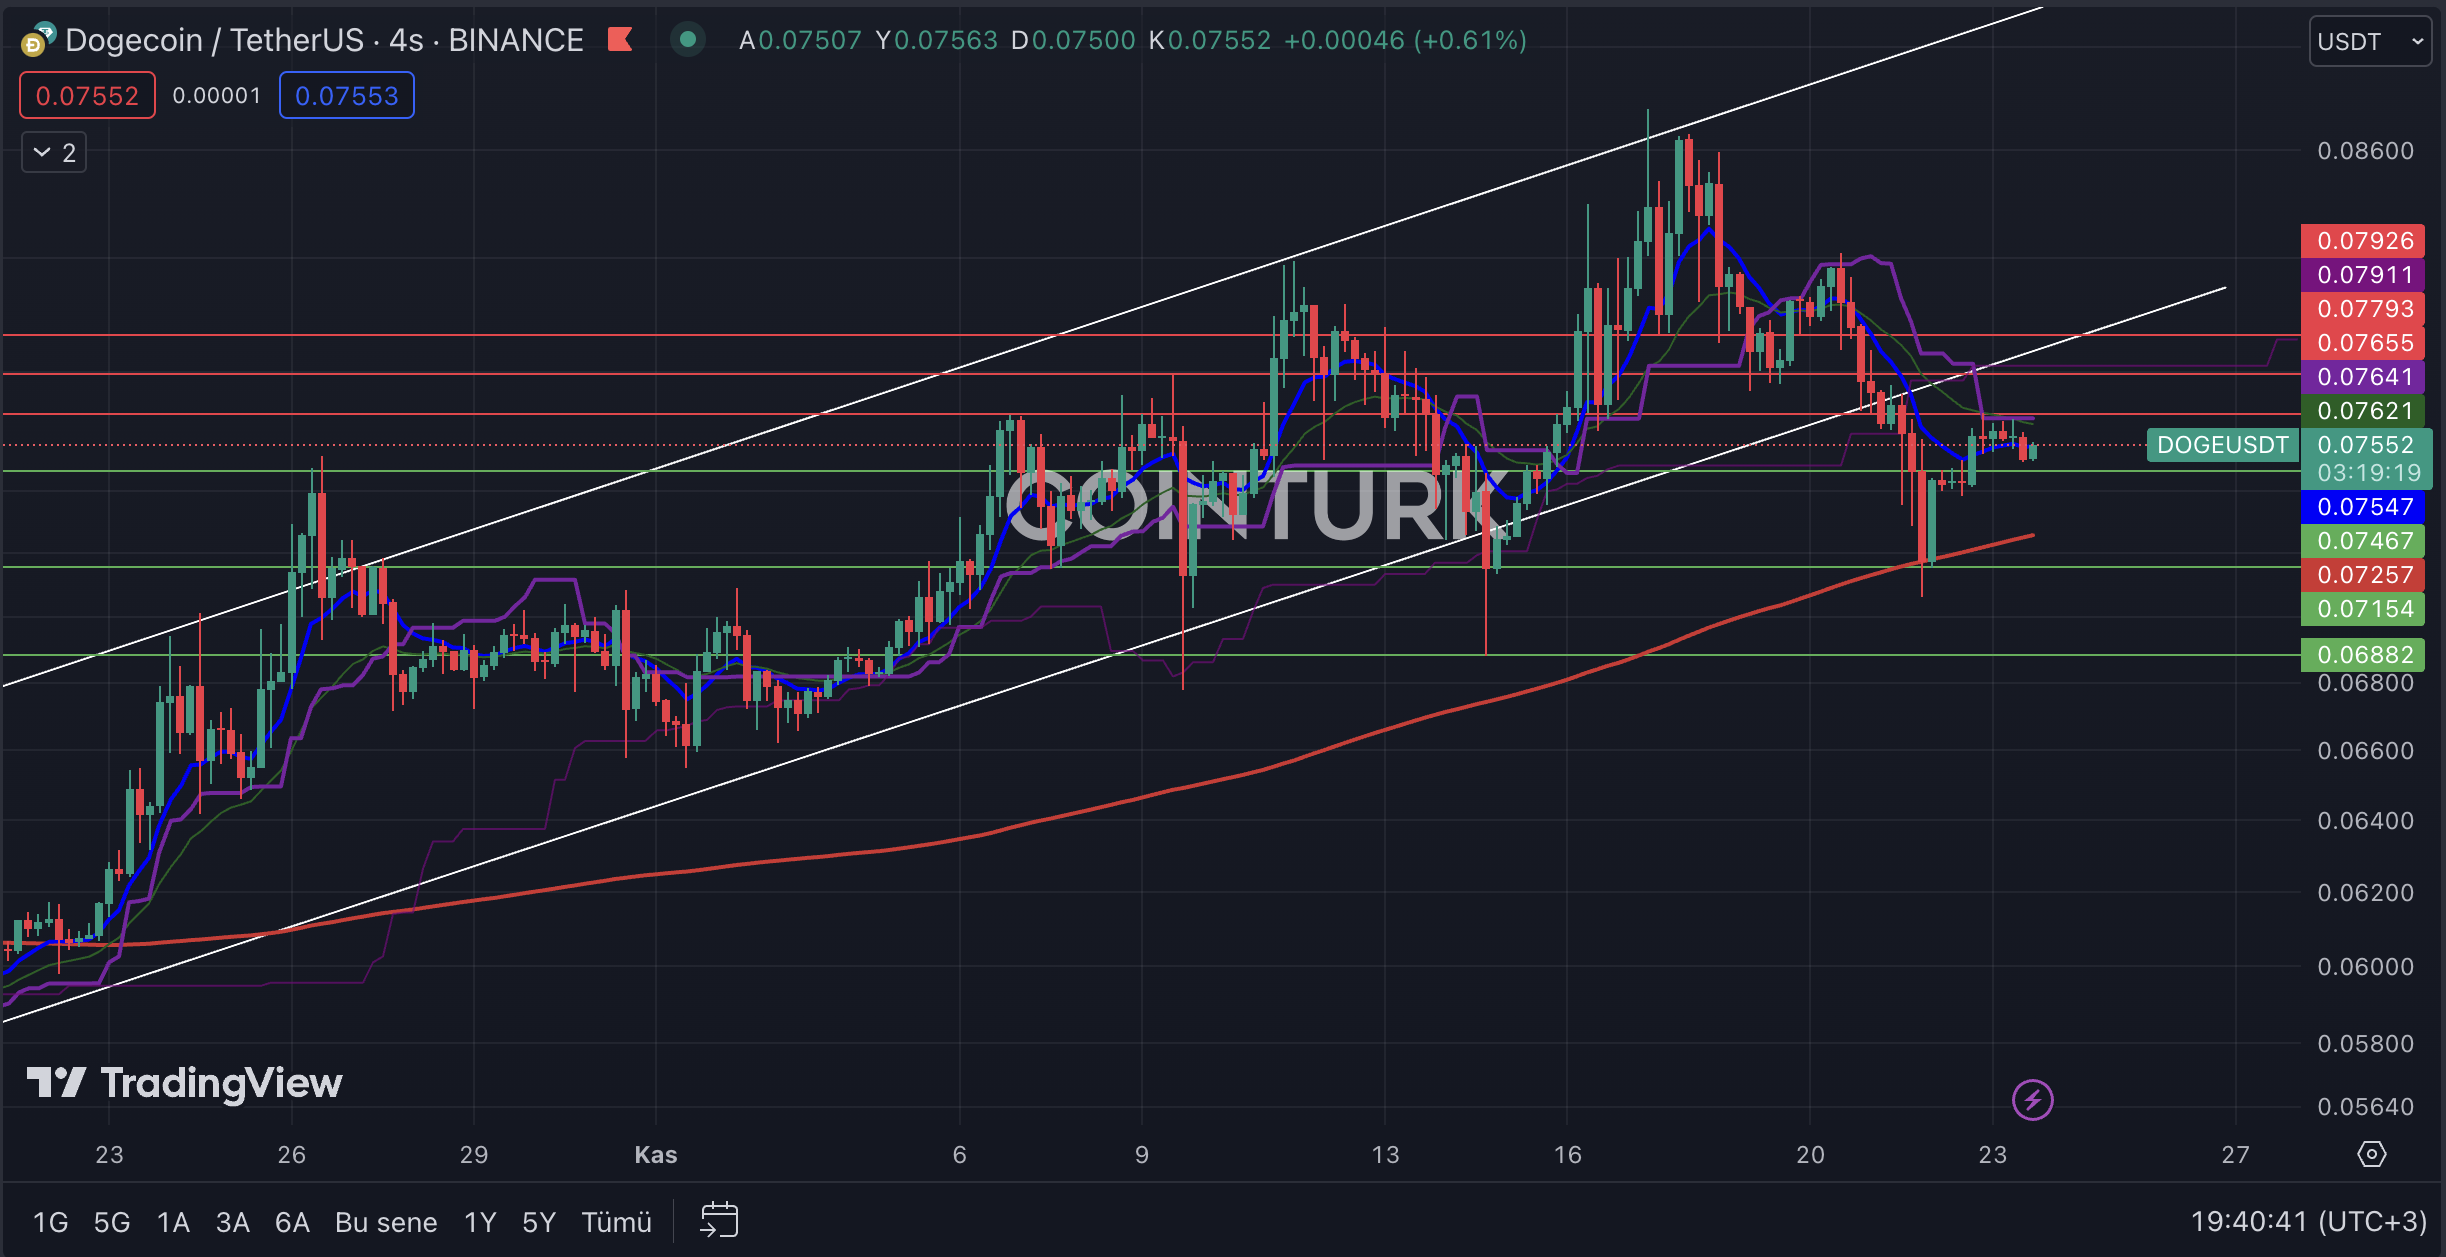
The four-hour chart analysis for Dogecoin shows a continuing anxious wait. According to this, DOGE, which experienced a support break after the correction that occurred on November 21 in the rising channel formation, has not yet entered the formation zone, despite completing its correction movement after finding support at the EMA 200 (red line) level. This situation is particularly important for short-term investors trading in the futures market.
The most important support levels to be followed for Dogecoin are respectively; $0.07467, $0.07154, and $0.06882. Especially for DOGE, which is trapped in a narrow range, if the four-hour bar closes below the $0.07467 level, it will cause the price to lose momentum again. After this process, the bar closure below the $0.07154 level, which intersects with the EMA 200 level, is the most important level that investors need to pay attention to.
Dogecoin에 대해 따라야 할 가장 중요한 지원 수준은 각각 다음과 같습니다. $0.07467, $0.07154, $0.06882. 특히 좁은 범위에 갇혀 있는 DOGE의 경우 4시간 막대가 $0.07467 수준 아래로 마감되면 가격이 다시 모멘텀을 잃게 됩니다. 이 과정을 거친 후 EMA 200 수준과 교차하는 $0.07154 수준 아래의 막대 폐쇄는 투자자가 주의해야 할 가장 중요한 수준입니다.
The most important resistance levels to be considered in the four-hour chart for Dogecoin are respectively; $0.07655, $0.07793, and $0.07926. Especially, if the four-hour bar closes above the $0.07793 level, it will help DOGE re-enter the formation zone and gain momentum.

Weekly Chart Analysis of Dogecoin
Dogecoin 주간 차트 분석
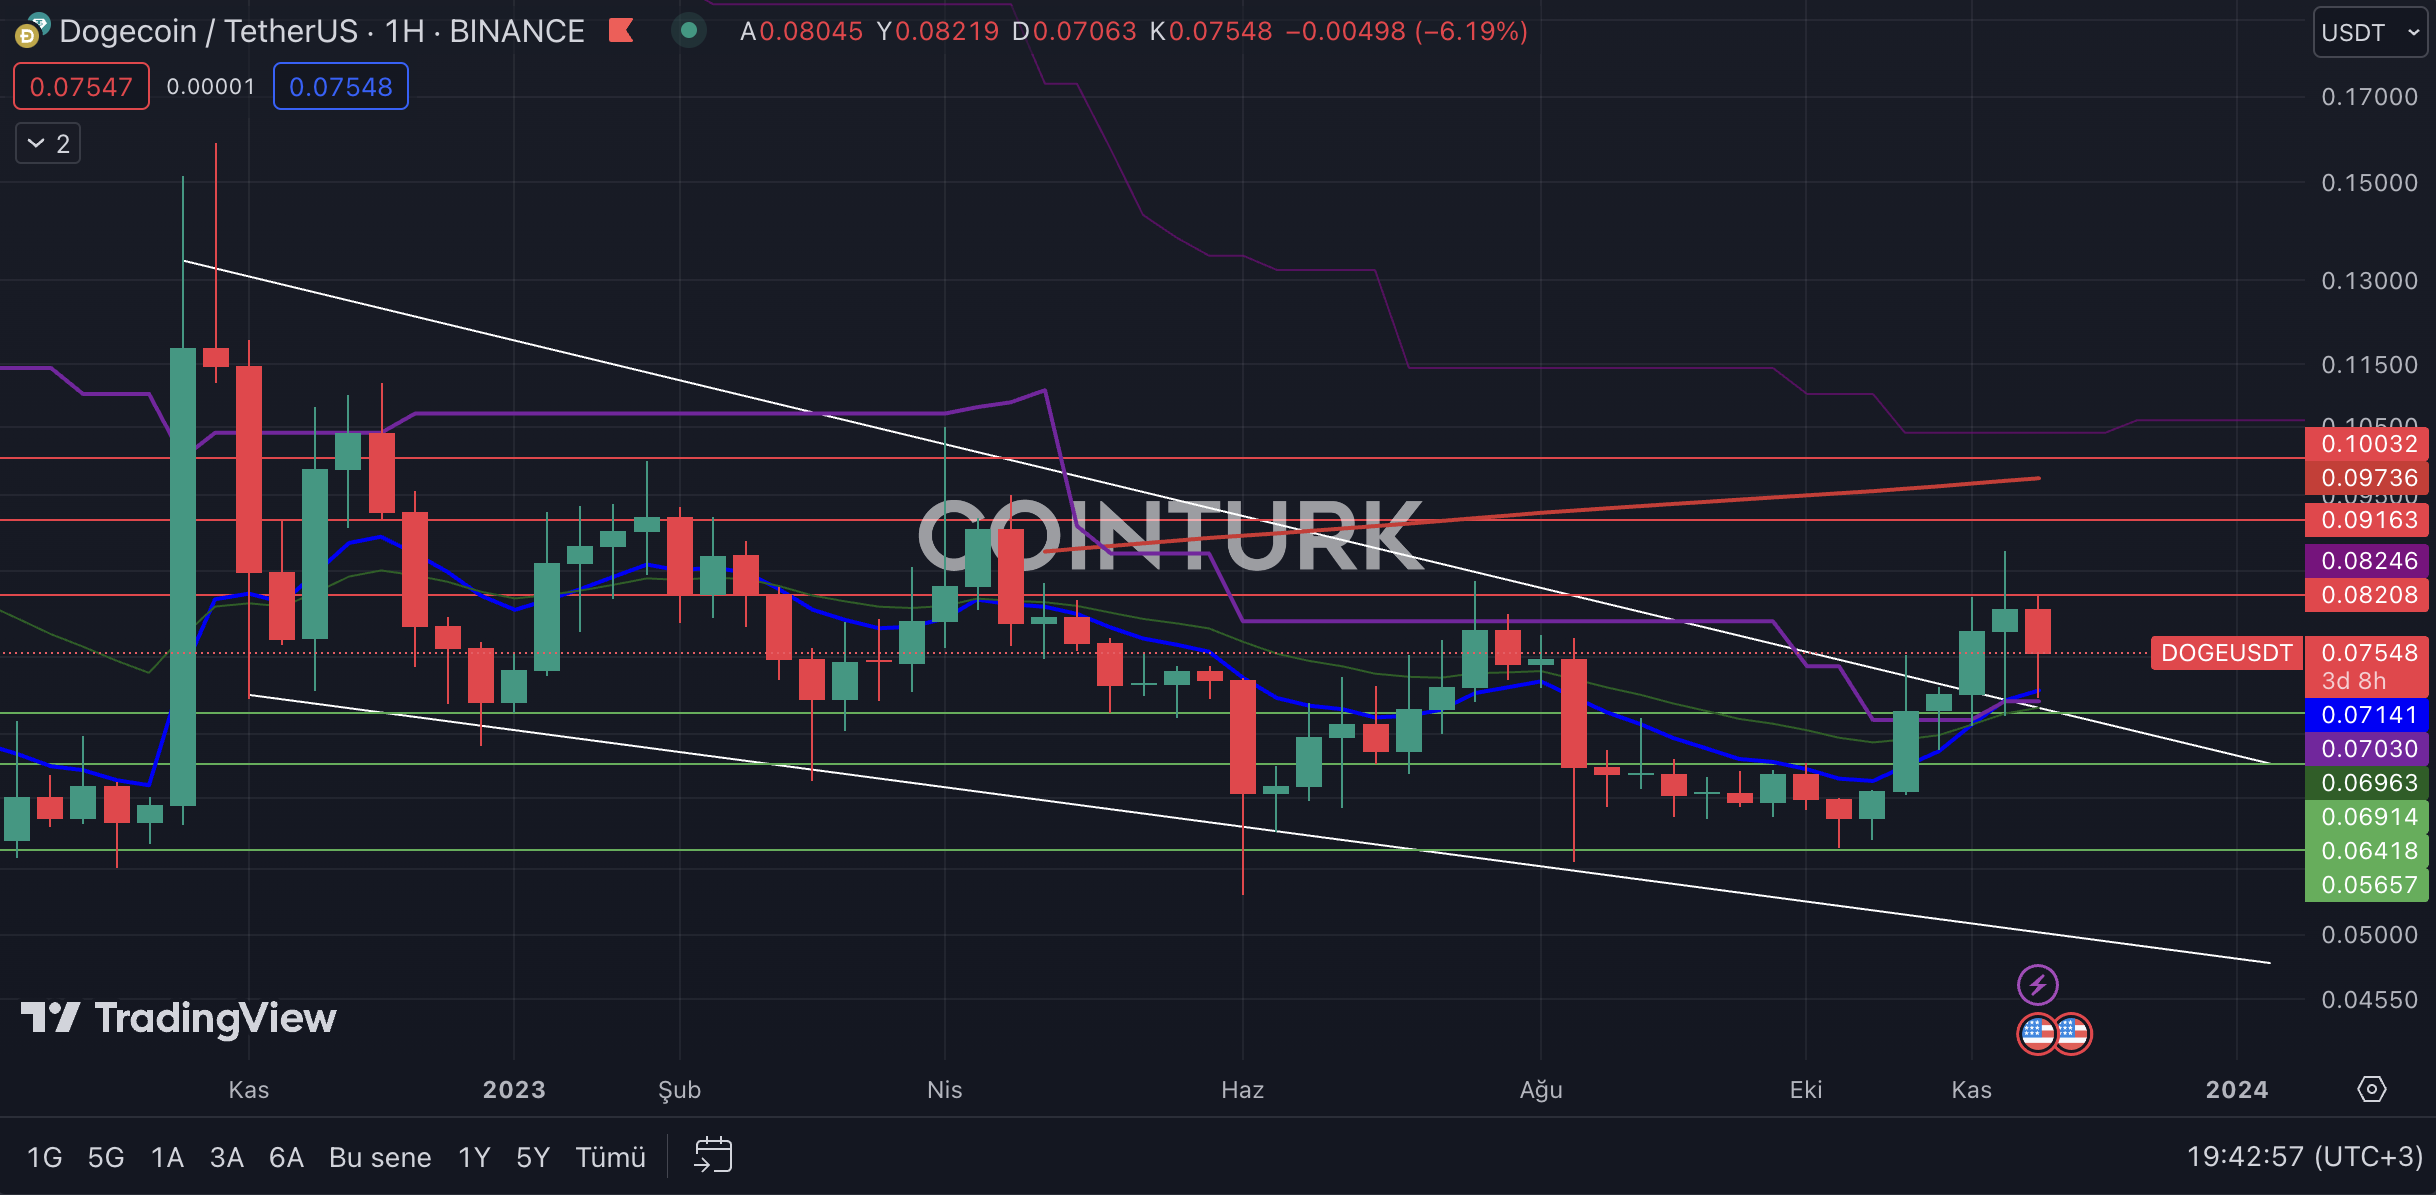
In the weekly chart analysis of Dogecoin, there is a narrowing channel formation that has been developing since November 2022. With the recent uptrend, DOGE managed to break the resistance line in this formation structure, and we saw that the resistance line worked as support during the correction that occurred this week. Such breakouts successfully attract the attention of investors in both the cryptocurrency market and traditional markets in terms of technical analysis.
Dogecoin의 주간 차트 분석에는 2022년 11월부터 전개되고 있는 좁은 채널 형성이 있습니다. 최근 상승 추세로 DOGE는 이 형성 구조에서 저항선을 돌파했으며, 저항선이 지지선으로 작용한 것을 확인했습니다. 이번주에 발생한 수정입니다. 이러한 돌파구는 기술적 분석 측면에서 암호화폐 시장과 전통 시장 모두에서 투자자들의 관심을 성공적으로 끌었습니다.
The most important support levels to be followed in the weekly chart for DOGE are respectively; $0.06914, $0.06418, and $0.05657. Especially, if the weekly bar closes below the $0.06914 level, it will cause the DOGE price to lose momentum.
The most important resistance levels to be considered in the weekly chart for DOGE are respectively; $0.08208, $0.09163, and $0.10032. Especially, if the weekly bar closes above the $0.10032 level, it will lead to the breakage of the EMA 200 level and the price gaining momentum.

계속 읽기: https://en.coin-turk.com/technical-analytic-of-dogecoin-important-support-and-resistance-levels/


 crypto.ro English
 DogeHome
 Crypto News Land
 ETHNews
 CFN
CFN U_Today
 Thecoinrepublic.com
 Optimisus


