You can also read this news on COINTURK NEWS: Altcoin Market Trends: Cardano, Avax, and Dogecoin Analysis
También puede leer esta noticia en COINTURK NEWS: Tendencias del mercado de Altcoin: Análisis de Cardano, Avax y Dogecoin
The cryptocurrency market is seeing many altcoins continue to draw the attention of investors. Recent popular altcoin projects, especially with their rising momentum, continue to please investors. This situation encourages users in blockchain projects and leads to increased activities within the ecosystem. So, what’s happening with Cardano, Avax, and Dogecoin lately? Let’s take a look.
En el mercado de las criptomonedas, muchas altcoins siguen atrayendo la atención de los inversores. Los recientes proyectos populares de altcoins, especialmente con su creciente impulso, continúan agradando a los inversores. Esta situación anima a los usuarios a participar en proyectos blockchain y conduce a un aumento de las actividades dentro del ecosistema. Entonces, ¿qué está pasando con Cardano, Avax y Dogecoin últimamente? Vamos a ver.
Cardano Chart Analysis
Análisis del gráfico Cardano
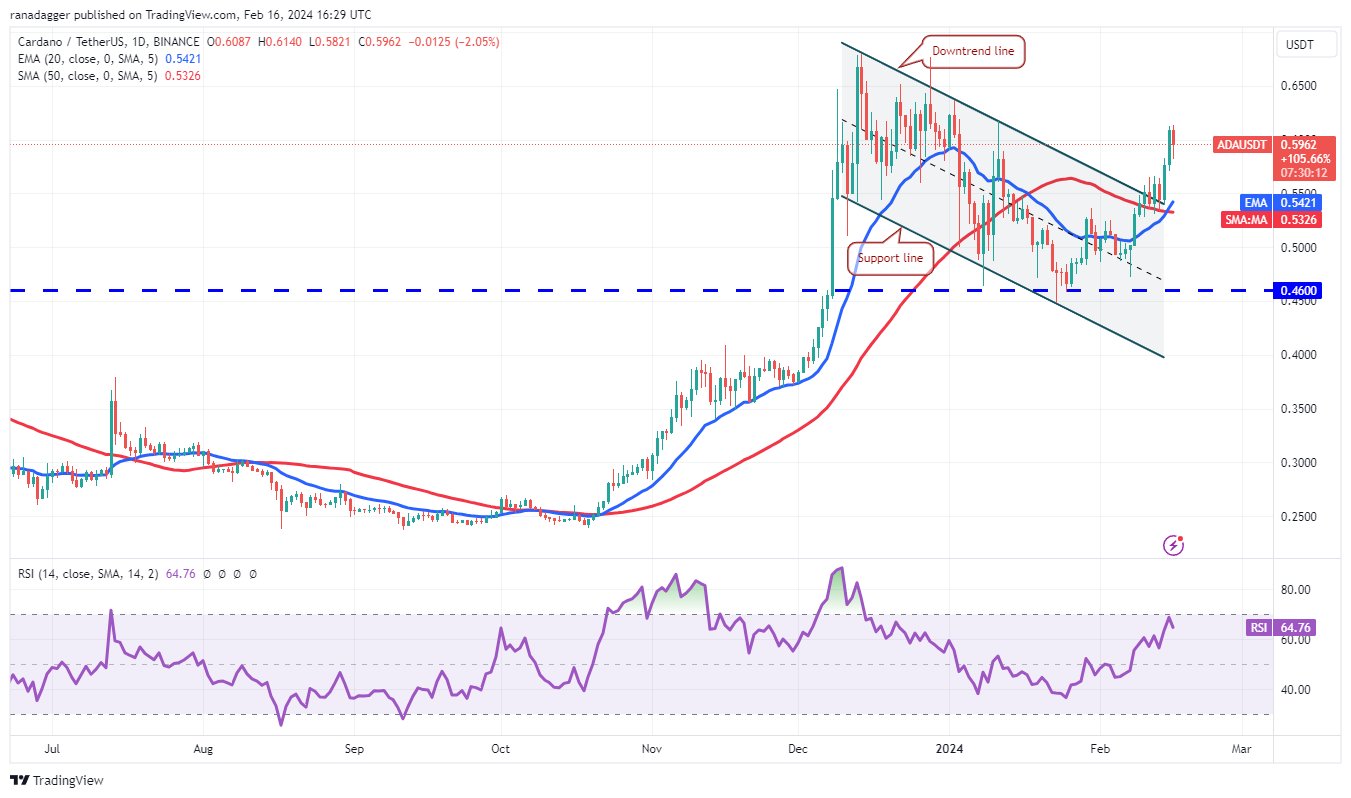
After struggling for a few days, Cardano gained momentum on February 14th, breaking above the sudden resistance level of $0.57. The rising 20-day EMA level at $0.54 and the RSI in the positive zone indicate a slight advantage for buyers. There’s a minor resistance at $0.62, but it is likely to be surpassed. The ADA/USDT pair could then climb to the strong general resistance at $0.68.
Después de luchar durante unos días, Cardano ganó impulso el 14 de febrero, superando el repentino nivel de resistencia de 0,57 dólares. El nivel creciente de la EMA de 20 días en 0,54$ y el RSI en la zona positiva indican una ligera ventaja para los compradores. Hay una resistencia menor en 0,62 dólares, pero es probable que sea superada. El par ADA/USDT podría entonces subir a la fuerte resistencia general de 0,68 dólares.

On the downside, the important support to watch is at the moving averages. A break and close below the 50-day SMA level of $0.53 would indicate that the recent breakout could have been a bull trap. The pair could then drop to the solid support at $0.46.
En el lado negativo, el soporte importante a tener en cuenta se encuentra en las medias móviles. Una ruptura y un cierre por debajo del nivel SMA de 50 días de $ 0,53 indicaría que la reciente ruptura podría haber sido una trampa alcista. Luego, el par podría caer hasta el soporte sólido de 0,46 dólares.
Avax Chart Analysis
Análisis de gráficos Avax
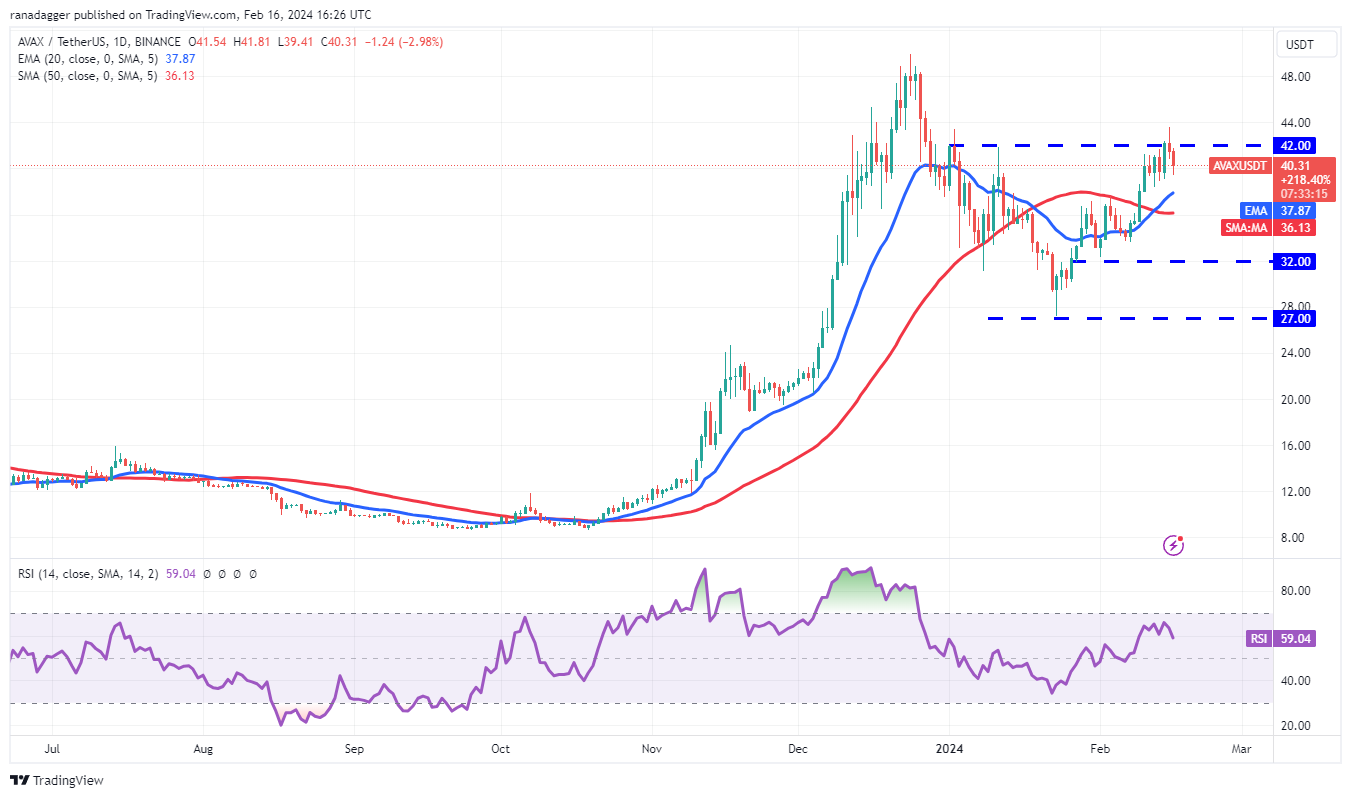
Buyers pushed Avax above the $42 peak resistance but failed to sustain higher levels as seen from the long wick on the February 15th candlestick.
Los compradores empujaron a Avax por encima de la resistencia máxima de $ 42, pero no lograron mantener niveles más altos, como se ve desde la mecha larga de la vela del 15 de febrero.

The price could drop to the first support line, the 20-day EMA level at $37.87. If the price rebounds from the 20-day EMA level, the likelihood of breaking above $42 increases. If this occurs, the AVAX/USDT pair could trigger a rally towards $50 by completing a reverse head and shoulders bullish formation.
El precio podría caer hasta la primera línea de soporte, el nivel de la EMA de 20 días en 37,87 dólares. Si el precio rebota desde el nivel de la EMA de 20 días, aumenta la probabilidad de superar los 42 dólares. Si esto ocurre, el par AVAX/USDT podría desencadenar un repunte hacia los $50 al completar una formación alcista inversa de cabeza y hombros.
Conversely, if the price continues to fall and drops below the moving average, the pair could be expected to trade between $32 and $42 for a while.
Por el contrario, si el precio continúa cayendo y cae por debajo de la media móvil, se podría esperar que el par se negocie entre $32 y $42 por un tiempo.
Dogecoin Chart Analysis
Análisis de gráficos de Dogecoin
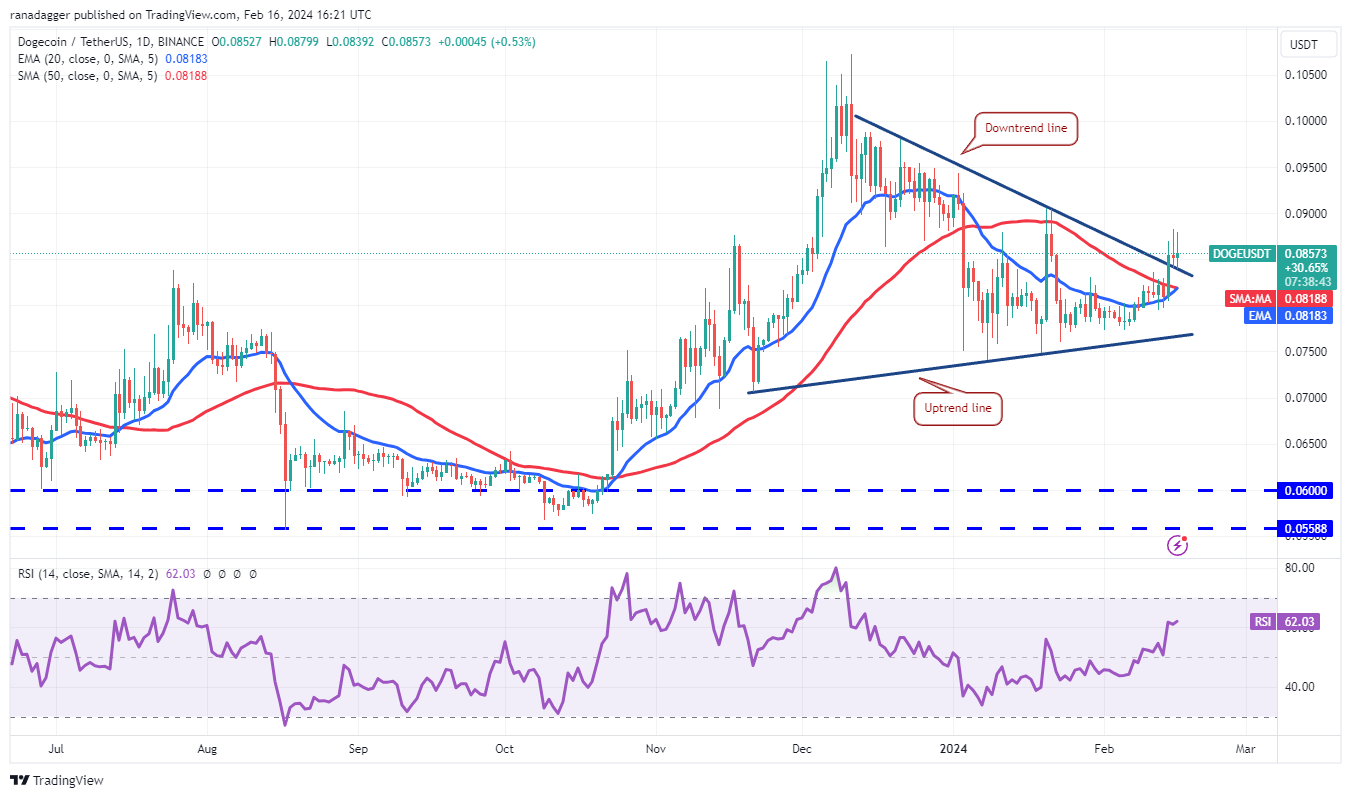
Dogecoin turned upwards from the 20-day EMA level of $0.08 on February 14th, breaking above the downtrend line and indicating buyers’ attempt to take control. If the price stays above the downtrend line, the DOGE/USDT pair is likely to gain momentum and rise towards the resistance zone between $0.10 and $0.11. A strong defense by sellers is expected in this area.
Dogecoin subió desde el nivel de la EMA de 20 días de $ 0,08 el 14 de febrero, superando la línea de tendencia bajista e indicando el intento de los compradores de tomar el control. Si el precio se mantiene por encima de la línea de tendencia bajista, es probable que el par DOGE/USDT gane impulso y suba hacia la zona de resistencia entre $0,10 y $0,11. Se espera una fuerte defensa por parte de los vendedores en esta zona.

Alternatively, if the price falls and drops below the 20-day EMA level, it would indicate that each high level is being sold off. The pair could then fall to the rising trend line and subsequently to the strong support at $0.07.
Alternativamente, si el precio cae y cae por debajo del nivel de la EMA de 20 días, indicaría que cada nivel máximo se está vendiendo. Luego, el par podría caer hasta la línea de tendencia ascendente y posteriormente hasta el fuerte soporte de 0,07 dólares.
The post first appeared on COINTURK NEWS: Altcoin Market Trends: Cardano, Avax, and Dogecoin Analysis
La publicación apareció por primera vez en COINTURK NEWS: Tendencias del mercado de Altcoin: Análisis de Cardano, Avax y Dogecoin


 Crypto Intelligence
 DogeHome
 Crypto News Land
 Crypto Daily™
 Crypto Intelligence
 Crypto Daily™
 CaptainAltcoin
 Thecryptoupdates
 Crypto Intelligence


