You can also read this news on COINTURK NEWS: Altcoin Market Trends: Cardano, Avax, and Dogecoin Analysis
COINTURK NEWS: Altcoin 시장 동향: Cardano, Avax 및 Dogecoin 분석에서도 이 뉴스를 읽을 수 있습니다.
The cryptocurrency market is seeing many altcoins continue to draw the attention of investors. Recent popular altcoin projects, especially with their rising momentum, continue to please investors. This situation encourages users in blockchain projects and leads to increased activities within the ecosystem. So, what’s happening with Cardano, Avax, and Dogecoin lately? Let’s take a look.
암호화폐 시장에서는 많은 알트코인이 계속해서 투자자들의 관심을 끌고 있는 것으로 보입니다. 최근 인기 있는 알트코인 프로젝트, 특히 상승세를 타고 있는 프로젝트는 계속해서 투자자들을 기쁘게 하고 있습니다. 이러한 상황은 블록체인 프로젝트의 사용자를 장려하고 생태계 내 활동 증가로 이어집니다. 그렇다면 최근 Cardano, Avax, Dogecoin에서는 무슨 일이 일어나고 있나요? 한 번 보자.
Cardano Chart Analysis
카르다노 차트 분석
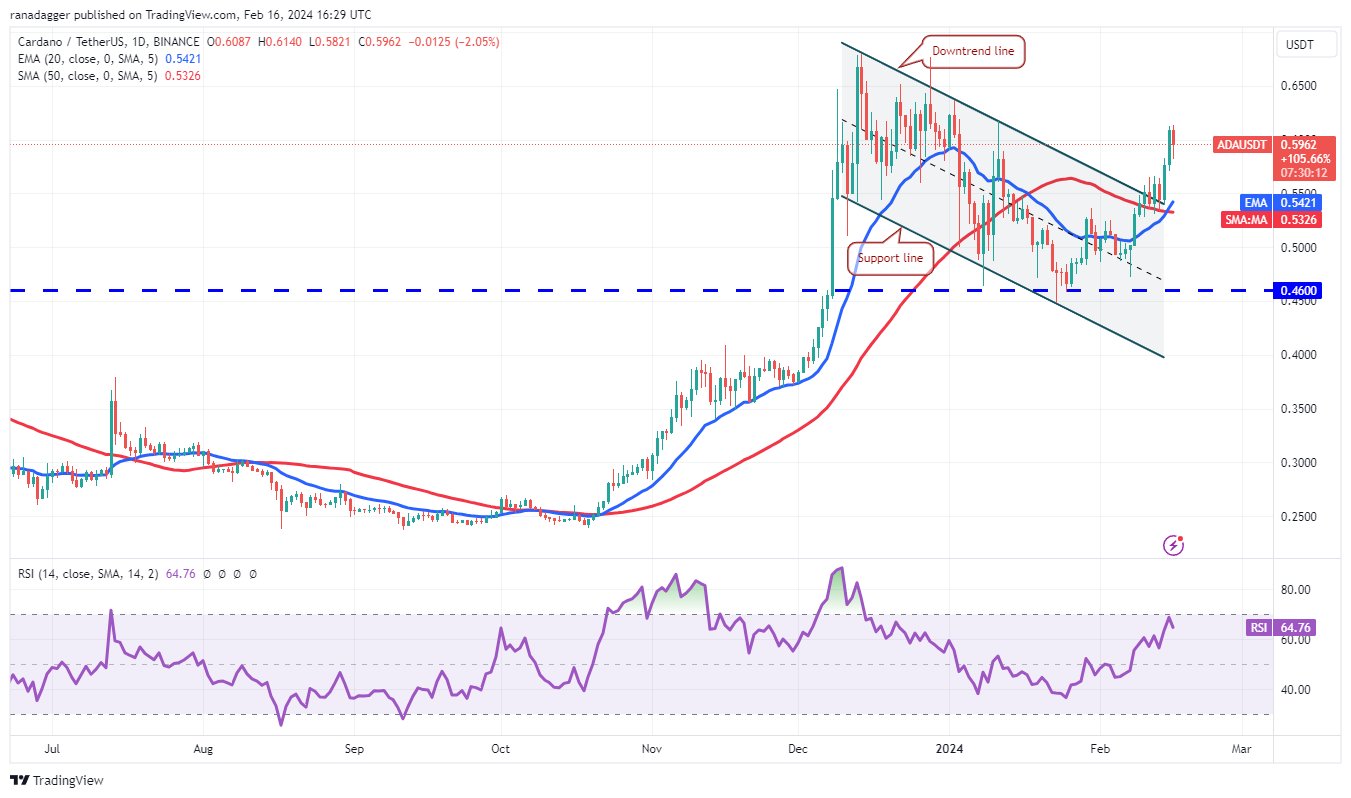
After struggling for a few days, Cardano gained momentum on February 14th, breaking above the sudden resistance level of $0.57. The rising 20-day EMA level at $0.54 and the RSI in the positive zone indicate a slight advantage for buyers. There’s a minor resistance at $0.62, but it is likely to be surpassed. The ADA/USDT pair could then climb to the strong general resistance at $0.68.
며칠간 어려움을 겪은 후 Cardano는 2월 14일에 추진력을 얻어 갑작스러운 저항선인 $0.57를 돌파했습니다. 20일 EMA 수준이 $0.54로 상승하고 RSI가 플러스 영역에 있는 것은 구매자에게 약간의 이점을 나타냅니다. 0.62달러에 약간의 저항이 있지만 이를 넘어설 가능성이 높습니다. 그러면 ADA/USDT 쌍은 $0.68의 강력한 일반 저항까지 올라갈 수 있습니다.

On the downside, the important support to watch is at the moving averages. A break and close below the 50-day SMA level of $0.53 would indicate that the recent breakout could have been a bull trap. The pair could then drop to the solid support at $0.46.
단점이라면 주목해야 할 중요한 지지선은 이동평균선입니다. 50일 SMA 수준인 $0.53 미만의 중단 및 마감은 최근 돌파가 황소 함정일 수 있음을 나타냅니다. 그러면 통화쌍은 $0.46의 견고한 지지선으로 떨어질 수 있습니다.
Avax Chart Analysis
Avax 차트 분석
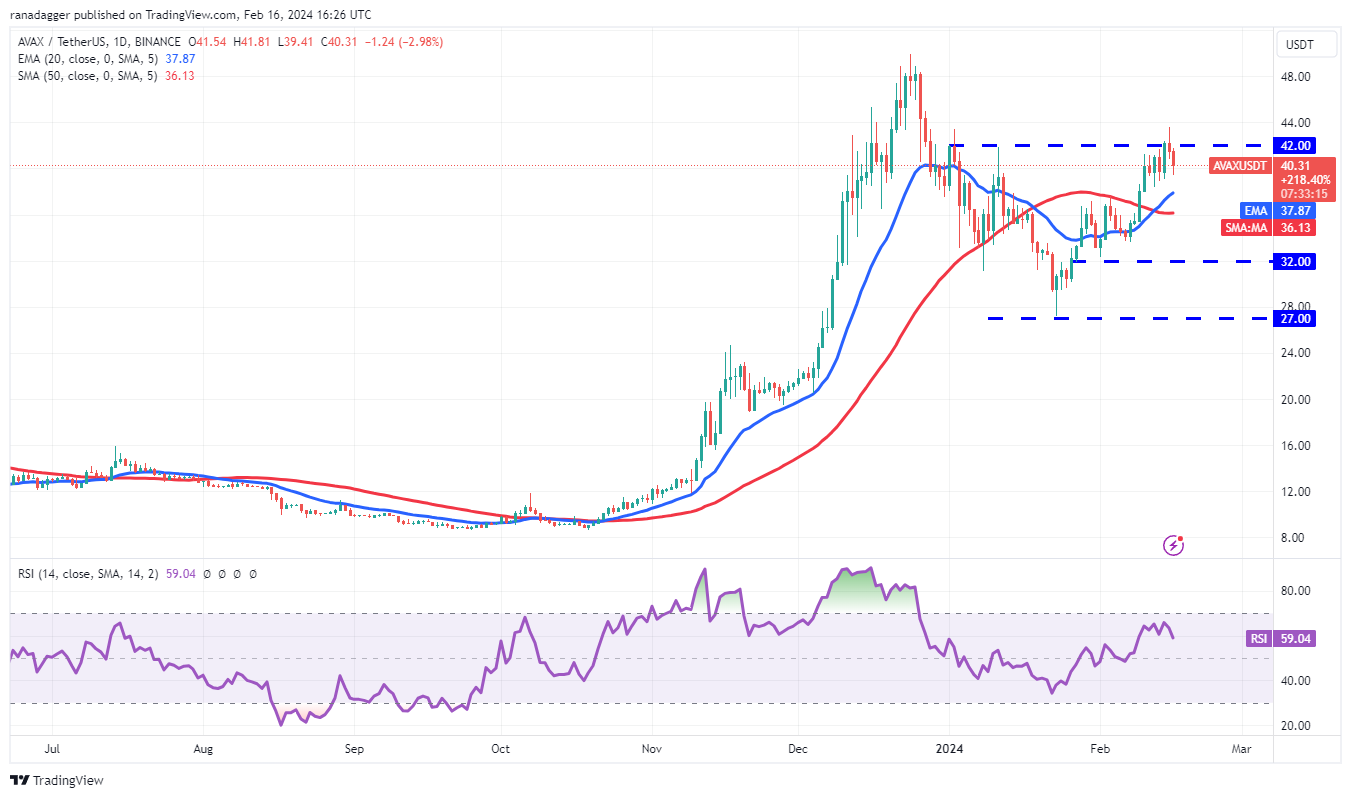
Buyers pushed Avax above the $42 peak resistance but failed to sustain higher levels as seen from the long wick on the February 15th candlestick.
구매자들은 Avax를 42달러 최고 저항선 위로 밀었지만 2월 15일 캔들스틱의 긴 심지에서 볼 수 있듯이 더 높은 수준을 유지하지 못했습니다.

The price could drop to the first support line, the 20-day EMA level at $37.87. If the price rebounds from the 20-day EMA level, the likelihood of breaking above $42 increases. If this occurs, the AVAX/USDT pair could trigger a rally towards $50 by completing a reverse head and shoulders bullish formation.
가격은 첫 번째 지지선인 20일 EMA 수준인 $37.87까지 하락할 수 있습니다. 가격이 20일 EMA 수준에서 반등하면 42달러를 넘어설 가능성이 높아집니다. 이런 일이 발생하면 AVAX/USDT 쌍은 역헤드 앤 숄더 강세 형성을 완료하여 50달러를 향해 상승하는 랠리를 촉발할 수 있습니다.
Conversely, if the price continues to fall and drops below the moving average, the pair could be expected to trade between $32 and $42 for a while.
반대로, 가격이 계속 하락하여 이동 평균 아래로 떨어지면 해당 쌍은 한동안 32달러에서 42달러 사이에서 거래될 것으로 예상할 수 있습니다.
Dogecoin Chart Analysis
도지코인 차트 분석
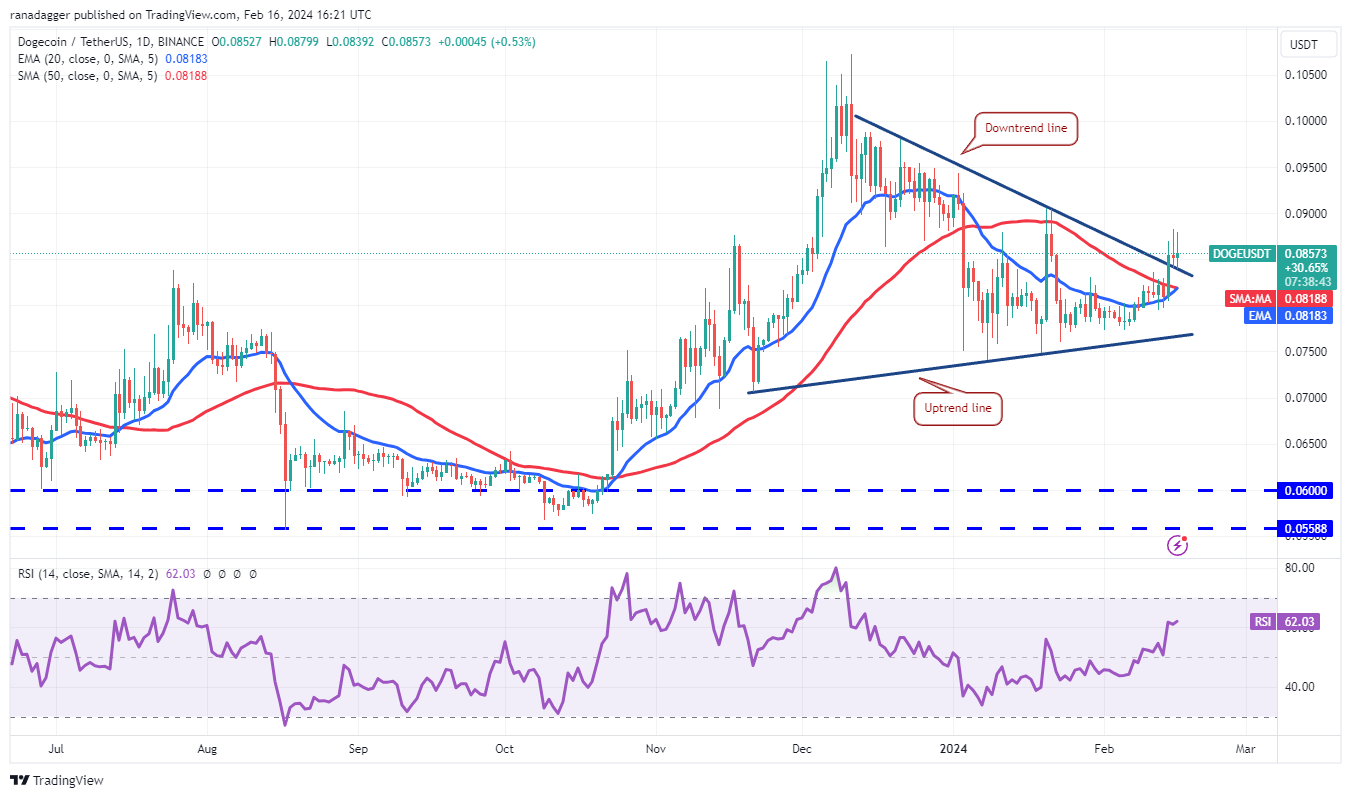
Dogecoin turned upwards from the 20-day EMA level of $0.08 on February 14th, breaking above the downtrend line and indicating buyers’ attempt to take control. If the price stays above the downtrend line, the DOGE/USDT pair is likely to gain momentum and rise towards the resistance zone between $0.10 and $0.11. A strong defense by sellers is expected in this area.
Dogecoin은 2월 14일 20일 EMA 수준인 $0.08에서 상승세를 보이며 하락 추세선을 넘어섰고 구매자가 주도권을 잡으려는 시도를 나타냈습니다. 가격이 하락 추세선 위에 머물면 DOGE/USDT 쌍은 추진력을 얻고 $0.10에서 $0.11 사이의 저항 영역을 향해 상승할 가능성이 높습니다. 이 부분에서는 판매자들의 강력한 방어가 예상된다.

Alternatively, if the price falls and drops below the 20-day EMA level, it would indicate that each high level is being sold off. The pair could then fall to the rising trend line and subsequently to the strong support at $0.07.
또는 가격이 하락하여 20일 EMA 수준 아래로 떨어지면 각 최고 수준이 매도되고 있음을 나타냅니다. 그런 다음 해당 쌍은 상승 추세선으로 하락한 후 $0.07의 강력한 지지선으로 떨어질 수 있습니다.
The post first appeared on COINTURK NEWS: Altcoin Market Trends: Cardano, Avax, and Dogecoin Analysis
해당 게시물은 COINTURK NEWS: Altcoin Market Trends: Cardano, Avax 및 Dogecoin Analysis에 처음 게재되었습니다.


 DeFi Planet
 Crypto Daily™
 BlockchainReporter
 TheCoinrise Media
 DogeHome
 Crypto Daily™
 Crypto Daily™
 TheCoinrise Media


