You can also read this news on COINTURK NEWS: Altcoin Market Trends: Cardano, Avax, and Dogecoin Analysis
このニュースは COINTURK NEWS でも読むことができます: アルトコイン市場動向: Cardano、Avax、および Dogecoin 分析
The cryptocurrency market is seeing many altcoins continue to draw the attention of investors. Recent popular altcoin projects, especially with their rising momentum, continue to please investors. This situation encourages users in blockchain projects and leads to increased activities within the ecosystem. So, what’s happening with Cardano, Avax, and Dogecoin lately? Let’s take a look.
暗号通貨市場では、多くのアルトコインが引き続き投資家の注目を集めています。最近の人気のアルトコインプロジェクトは、特にその勢いが増しており、引き続き投資家を喜ばせています。この状況は、ユーザーがブロックチェーン プロジェクトに参加することを奨励し、エコシステム内の活動の増加につながります。では、Cardano、Avax、Dogecoin に最近何が起こっているのでしょうか?見てみましょう。
Cardano Chart Analysis
Cardano チャート分析
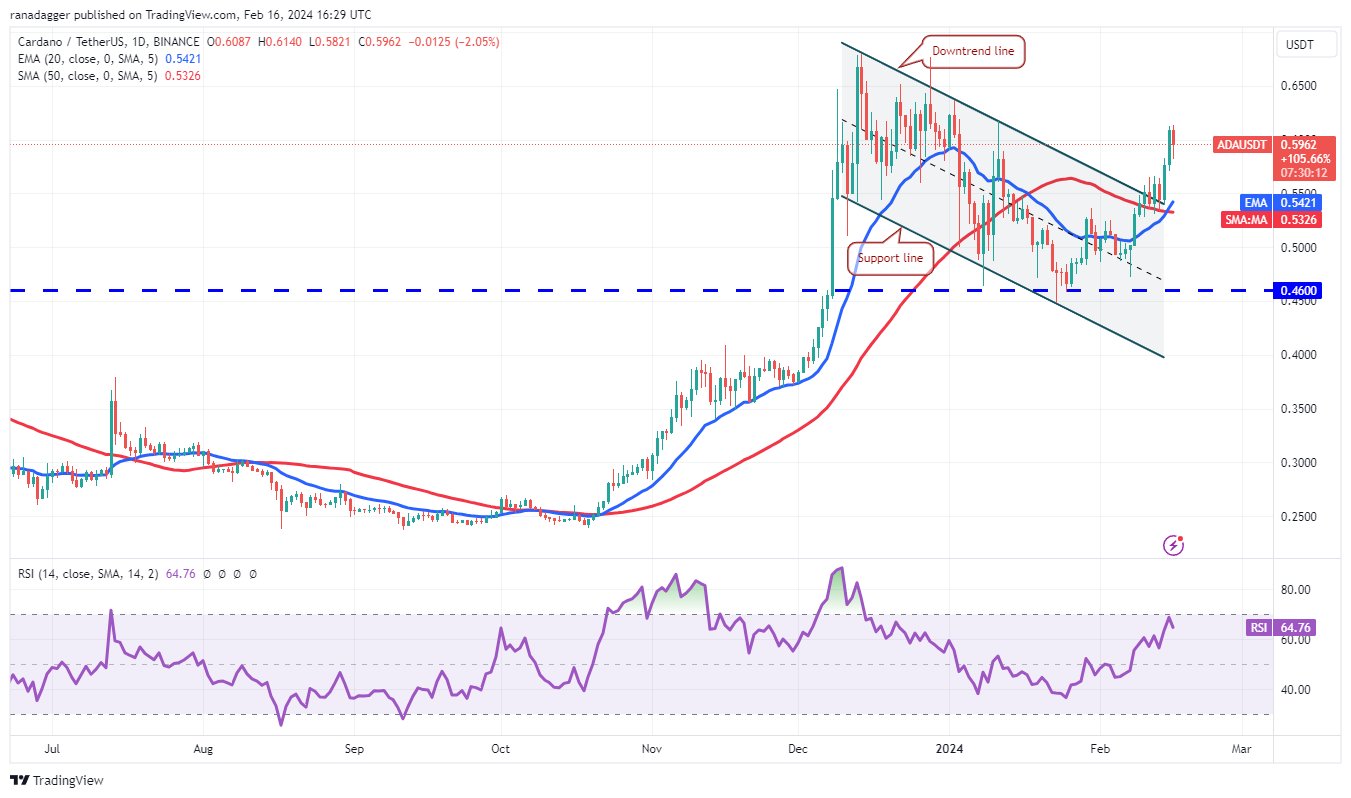
After struggling for a few days, Cardano gained momentum on February 14th, breaking above the sudden resistance level of $0.57. The rising 20-day EMA level at $0.54 and the RSI in the positive zone indicate a slight advantage for buyers. There’s a minor resistance at $0.62, but it is likely to be surpassed. The ADA/USDT pair could then climb to the strong general resistance at $0.68.
数日間苦戦した後、カルダノは2月14日に勢いを増し、突然の抵抗レベルである0.57ドルを突破しました。 20 日間 EMA レベルが 0.54 ドルで上昇し、RSI がプラスゾーンにあることは、買い手が若干有利であることを示しています。 0.62ドルに小さな抵抗線があるが、それは超えられる可能性が高い。その後、ADA/USDTペアは0.68ドルの強い一般抵抗線まで上昇する可能性がある。

On the downside, the important support to watch is at the moving averages. A break and close below the 50-day SMA level of $0.53 would indicate that the recent breakout could have been a bull trap. The pair could then drop to the solid support at $0.46.
マイナス面では、注目すべき重要なサポートは移動平均にあります。 50日間SMAレベルの0.53ドルを下回って終値をとった場合は、最近のブレイクアウトが強気の罠だった可能性があることを示しています。その後、ペアは0.46ドルの堅調なサポートまで下落する可能性がある。
Avax Chart Analysis
Avax チャート分析
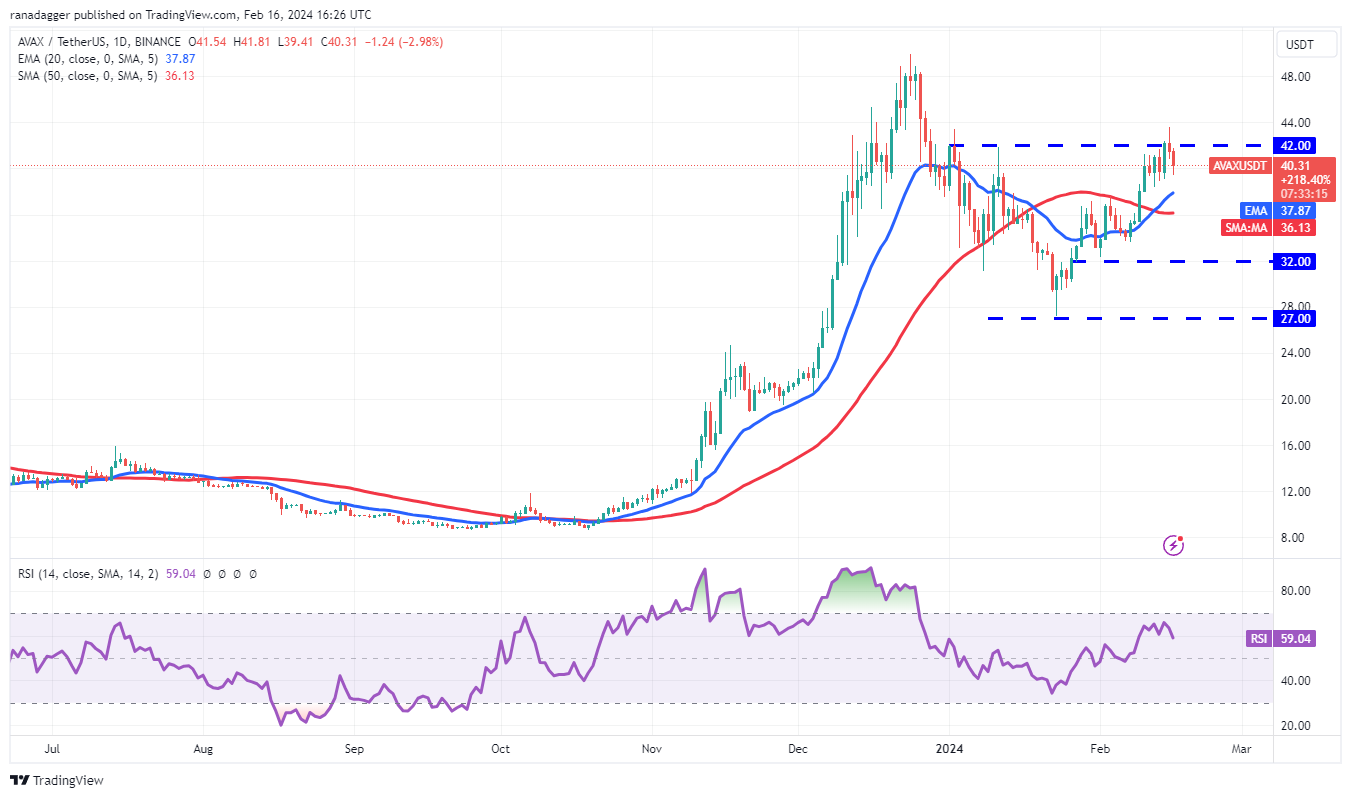
Buyers pushed Avax above the $42 peak resistance but failed to sustain higher levels as seen from the long wick on the February 15th candlestick.
買い手はエイバックスを42ドルのピーク抵抗線を超えて押し上げたが、2月15日のローソク足の長い芯からわかるように、より高い水準を維持することができなかった。

The price could drop to the first support line, the 20-day EMA level at $37.87. If the price rebounds from the 20-day EMA level, the likelihood of breaking above $42 increases. If this occurs, the AVAX/USDT pair could trigger a rally towards $50 by completing a reverse head and shoulders bullish formation.
価格は最初のサポートラインである20日間EMAレベルの37.87ドルまで下落する可能性がある。価格が20日間EMAレベルから回復した場合、42ドルを突破する可能性が高まります。これが発生した場合、AVAX/USDTペアはリバース・ヘッド・アンド・ショルダーの強気フォーメーションを完了することで、50ドルに向けた上昇を引き起こす可能性がある。
Conversely, if the price continues to fall and drops below the moving average, the pair could be expected to trade between $32 and $42 for a while.
逆に、価格が下落し続け、移動平均を下回った場合、ペアはしばらくの間32ドルから42ドルの間で取引されることが予想されます。
Dogecoin Chart Analysis
ドージコインチャート分析
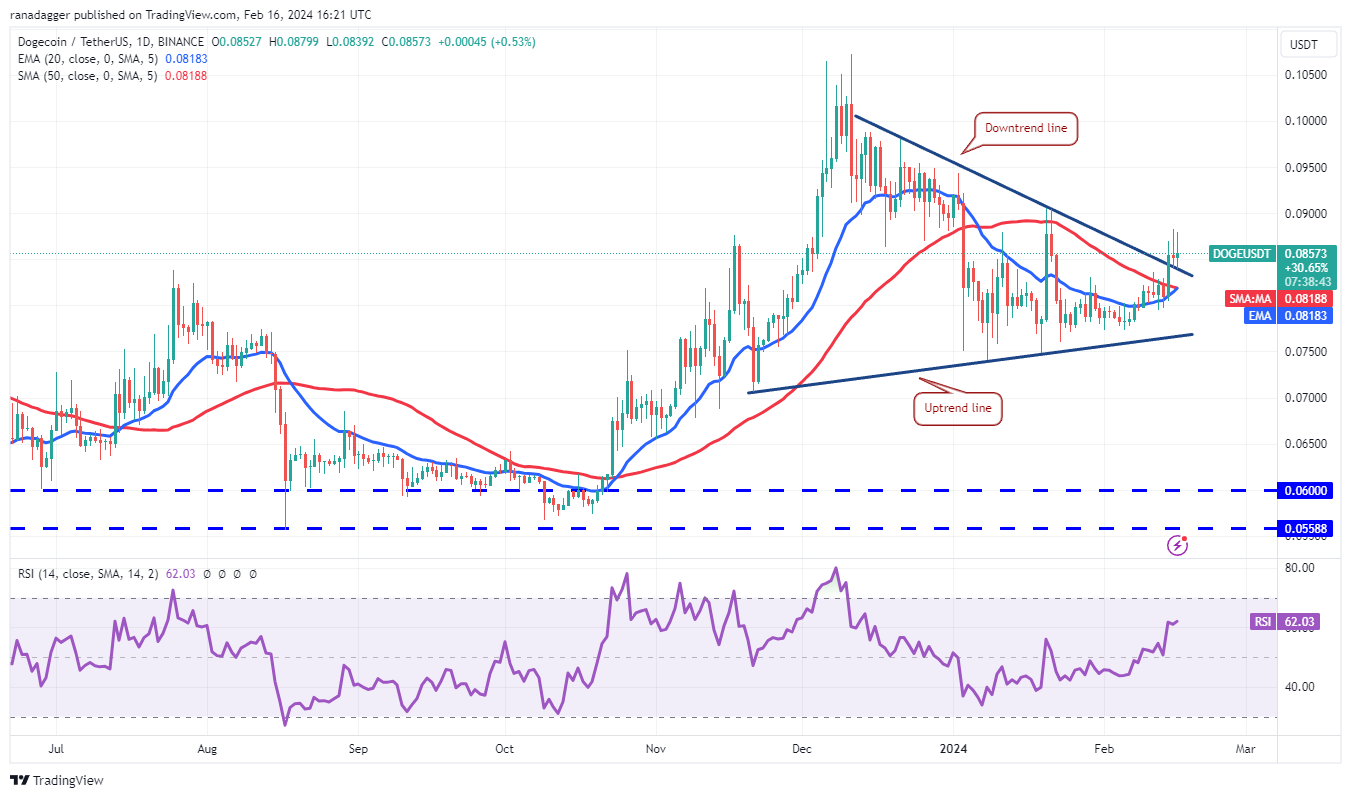
Dogecoin turned upwards from the 20-day EMA level of $0.08 on February 14th, breaking above the downtrend line and indicating buyers’ attempt to take control. If the price stays above the downtrend line, the DOGE/USDT pair is likely to gain momentum and rise towards the resistance zone between $0.10 and $0.11. A strong defense by sellers is expected in this area.
ドージコインは2月14日の20日間EMAレベルの0.08ドルから上昇に転じ、下降トレンドラインを突破し、買い手が主導権を握ろうとしていることを示した。価格が下降トレンドラインを上回った場合、DOGE/USDTペアは勢いを増し、0.10ドルから0.11ドルの間のレジスタンスゾーンに向かって上昇する可能性があります。この分野では売り手の強力な防御が予想される。

Alternatively, if the price falls and drops below the 20-day EMA level, it would indicate that each high level is being sold off. The pair could then fall to the rising trend line and subsequently to the strong support at $0.07.
あるいは、価格が下落して20日間EMAレベルを下回った場合、各高値レベルが売られていることを示します。その後、ペアは上昇トレンドラインに下落し、その後0.07ドルの強力なサポートに下落する可能性があります。
The post first appeared on COINTURK NEWS: Altcoin Market Trends: Cardano, Avax, and Dogecoin Analysis
この投稿は COINTURK NEWS に最初に掲載されました: アルトコイン市場動向: カルダノ、エイバックス、ドージコイン分析


 DeFi Planet
 Crypto Daily™
 BlockchainReporter
 TheCoinrise Media
 DogeHome
 Crypto Daily™
 Crypto Daily™
 TheCoinrise Media


