You can also read this news on COINTURK NEWS: Altcoin Market Trends: Cardano, Avax, and Dogecoin Analysis
您还可以在 COINTURK NEWS 上阅读此新闻:Altcoin 市场趋势:Cardano、Avax 和 Dogecoin 分析
The cryptocurrency market is seeing many altcoins continue to draw the attention of investors. Recent popular altcoin projects, especially with their rising momentum, continue to please investors. This situation encourages users in blockchain projects and leads to increased activities within the ecosystem. So, what’s happening with Cardano, Avax, and Dogecoin lately? Let’s take a look.
加密货币市场上许多山寨币继续吸引投资者的关注。最近流行的山寨币项目,尤其是其不断上升的势头,继续令投资者满意。这种情况鼓励了区块链项目的用户,并导致生态系统内的活动增加。那么,Cardano、Avax 和 Dogecoin 最近发生了什么?让我们来看看。
Cardano Chart Analysis
卡尔达诺图表分析
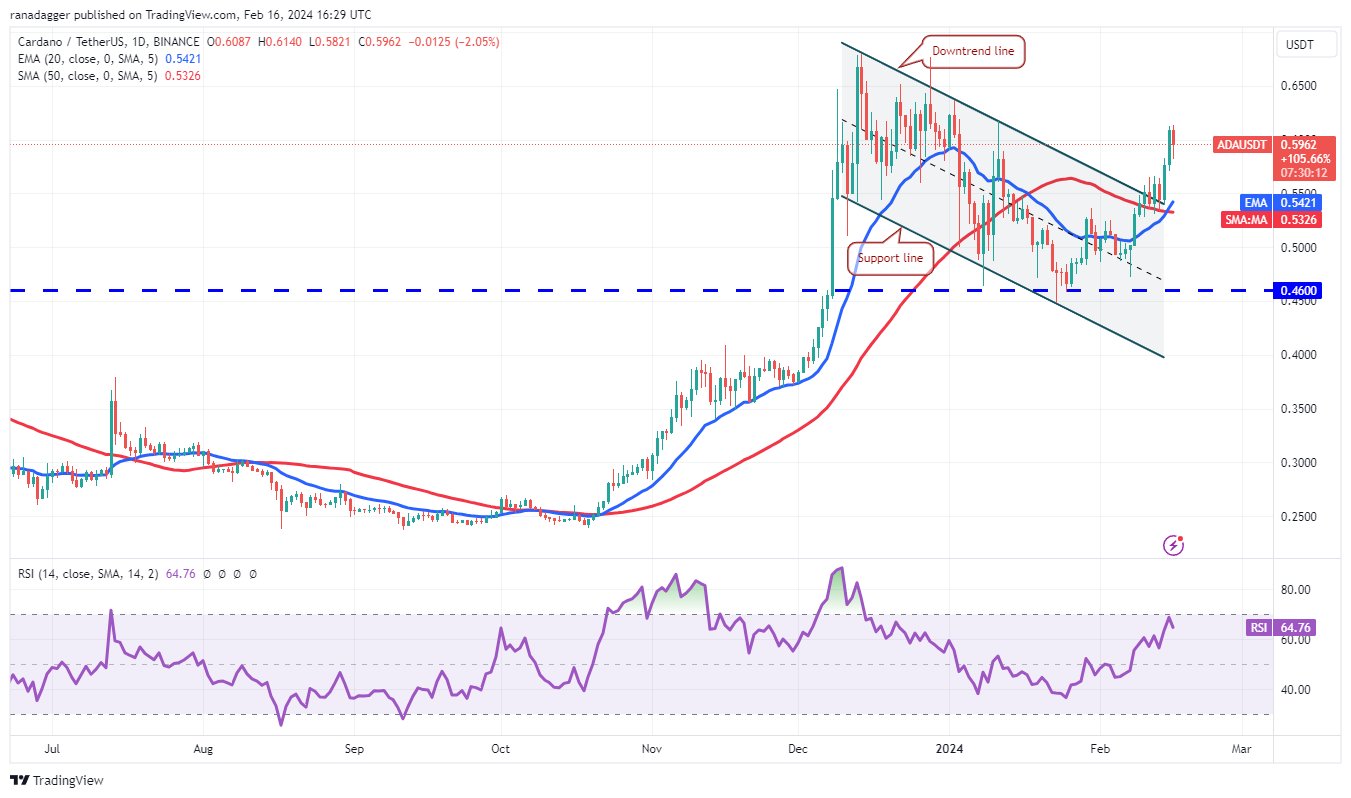
After struggling for a few days, Cardano gained momentum on February 14th, breaking above the sudden resistance level of $0.57. The rising 20-day EMA level at $0.54 and the RSI in the positive zone indicate a slight advantage for buyers. There’s a minor resistance at $0.62, but it is likely to be surpassed. The ADA/USDT pair could then climb to the strong general resistance at $0.68.
经过几天的挣扎后,卡尔达诺在 2 月 14 日获得动力,突破了 0.57 美元的突然阻力位。 20 日 EMA 水平上升至 0.54 美元,RSI 处于正值区域,表明买家略有优势。 0.62 美元有一个小阻力,但很可能会被超越。随后,ADA/USDT 货币对可能会攀升至 0.68 美元的强劲阻力位。

On the downside, the important support to watch is at the moving averages. A break and close below the 50-day SMA level of $0.53 would indicate that the recent breakout could have been a bull trap. The pair could then drop to the solid support at $0.46.
不利的一面是,值得关注的重要支撑位是移动平均线。突破并收盘于 0.53 美元的 50 日移动平均线下方,表明近期的突破可能是牛市陷阱。随后该货币对可能会跌至 0.46 美元的坚实支撑位。
Avax Chart Analysis
Avax 图表分析
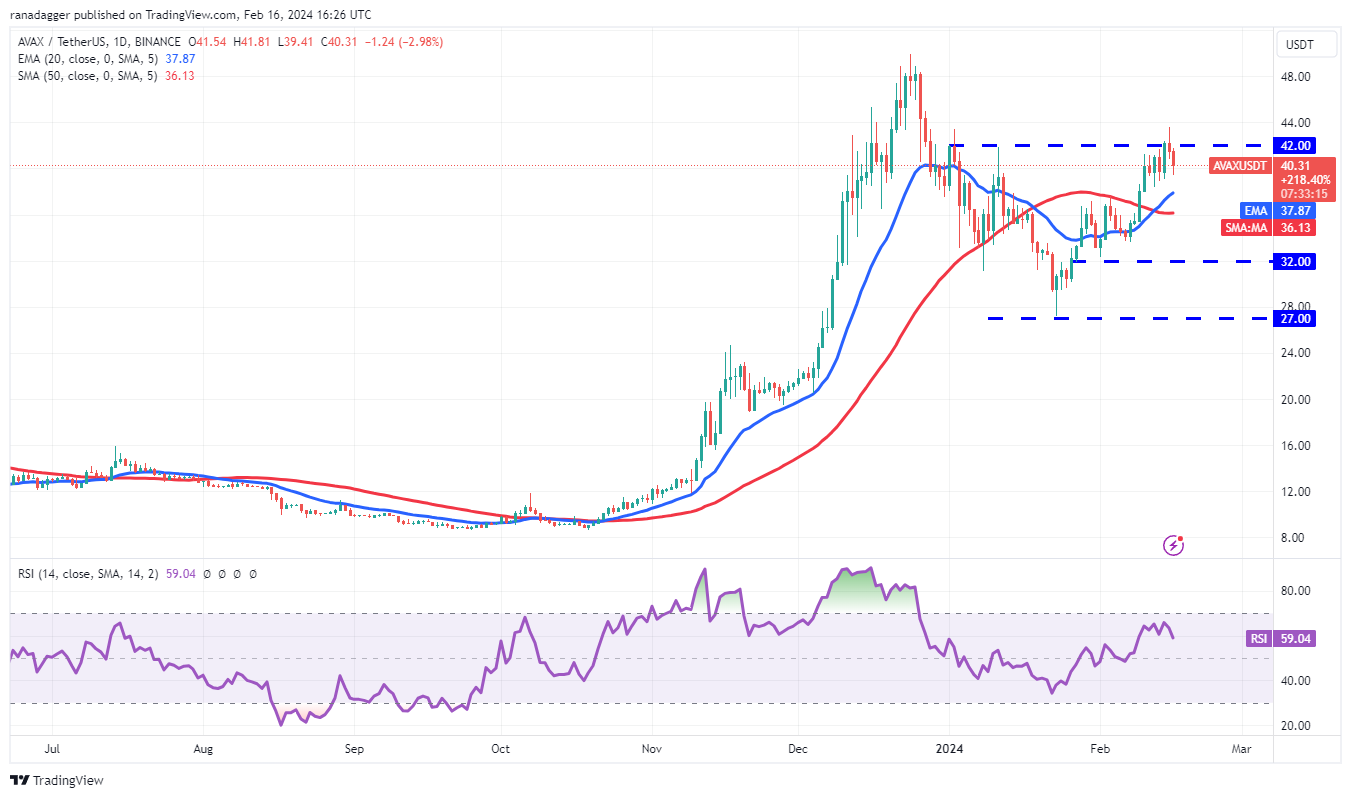
Buyers pushed Avax above the $42 peak resistance but failed to sustain higher levels as seen from the long wick on the February 15th candlestick.
买家将 Avax 推升至 42 美元峰值阻力位之上,但未能维持较高水平,如 2 月 15 日烛台上的长影线所示。

The price could drop to the first support line, the 20-day EMA level at $37.87. If the price rebounds from the 20-day EMA level, the likelihood of breaking above $42 increases. If this occurs, the AVAX/USDT pair could trigger a rally towards $50 by completing a reverse head and shoulders bullish formation.
价格可能会跌至第一条支撑线,即 20 日均线 37.87 美元。如果价格从 20 日均线水平反弹,突破 42 美元的可能性就会增加。如果发生这种情况,AVAX/USDT 货币对可能会通过完成反向头肩形看涨形态而触发反弹至 50 美元。
Conversely, if the price continues to fall and drops below the moving average, the pair could be expected to trade between $32 and $42 for a while.
相反,如果价格继续下跌并跌破移动平均线,则预计该货币对将在 32 美元至 42 美元之间交易一段时间。
Dogecoin Chart Analysis
狗狗币图表分析
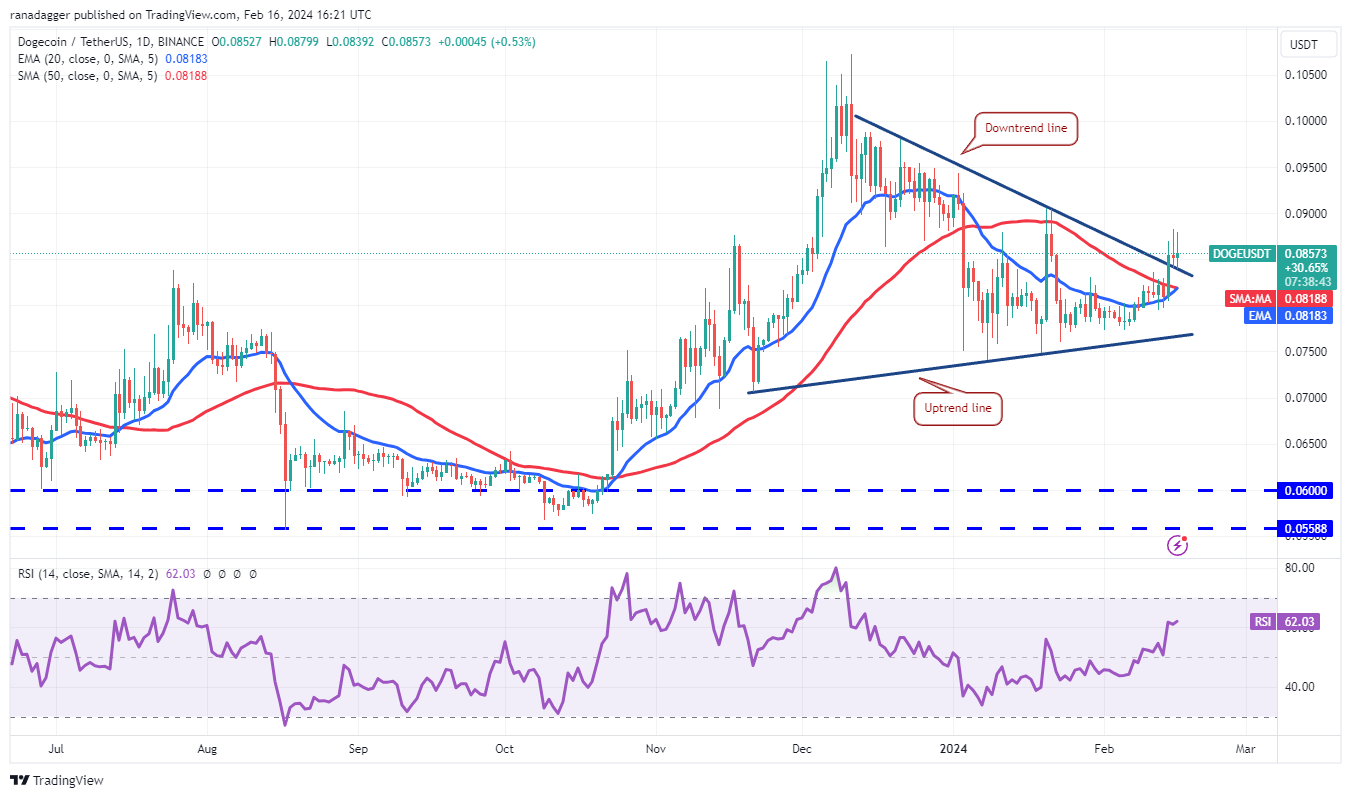
Dogecoin turned upwards from the 20-day EMA level of $0.08 on February 14th, breaking above the downtrend line and indicating buyers’ attempt to take control. If the price stays above the downtrend line, the DOGE/USDT pair is likely to gain momentum and rise towards the resistance zone between $0.10 and $0.11. A strong defense by sellers is expected in this area.
狗狗币从 2 月 14 日的 20 日均线 0.08 美元开始向上,突破下降趋势线,表明买家试图控制局面。如果价格保持在下降趋势线上方,DOGE/USDT 货币对可能会获得动力并上涨至 0.10 美元至 0.11 美元之间的阻力区。预计该领域卖家将采取强有力的防御措施。

Alternatively, if the price falls and drops below the 20-day EMA level, it would indicate that each high level is being sold off. The pair could then fall to the rising trend line and subsequently to the strong support at $0.07.
或者,如果价格下跌并跌破 20 日均线,则表明每个高位都被抛售。随后该货币对可能会跌至上升趋势线,随后跌至 0.07 美元的强支撑位。
The post first appeared on COINTURK NEWS: Altcoin Market Trends: Cardano, Avax, and Dogecoin Analysis
该帖子首次出现在 COINTURK 新闻上:山寨币市场趋势:Cardano、Avax 和 Dogecoin 分析


 Optimisus
 Optimisus
 DeFi Planet
 Crypto Daily™
 BlockchainReporter
 TheCoinrise Media
 DogeHome
 Crypto Daily™
 Crypto Daily™


