Dogecoin (DOGE) has maintained its position near the $0.077 horizontal support level since the year began. Analysis of both daily and six-hour time frames, along with RSI readings, suggests a potential downtrend in DOGE’s price. Nevertheless, breaching the resistance trendline might trigger a rebound, defying bearish expectations.
Dogecoin (DOGE) ha mantenido su posición cerca del nivel de soporte horizontal de 0,077 dólares desde que comenzó el año. El análisis de los marcos temporales diarios y de seis horas, junto con las lecturas del RSI, sugiere una posible tendencia a la baja en el precio de DOGE. Sin embargo, romper la línea de tendencia de resistencia podría desencadenar un rebote, desafiando las expectativas bajistas.

Cryptos Headlines Platform Has Launched Its Native Token's Airdrop for the Public Join Airdrop Now
La plataforma Cryptos Headlines ha lanzado el lanzamiento aéreo de su token nativo para el público Únase al lanzamiento aéreo ahora
DOGE price is currently trading within a long-term corrective pattern and a short-term bearish trend. It has revisited a horizontal support zone established since the beginning of the year. The critical question remains: will it bounce off this support level or break down?
El precio de DOGE se cotiza actualmente dentro de un patrón correctivo a largo plazo y una tendencia bajista a corto plazo. Ha revisado una zona de soporte horizontal establecida desde principios de año. La pregunta crítica sigue siendo: ¿rebotará en este nivel de soporte o sufrirá una caída?
Dogecoin (DOGE) Technical Analysis
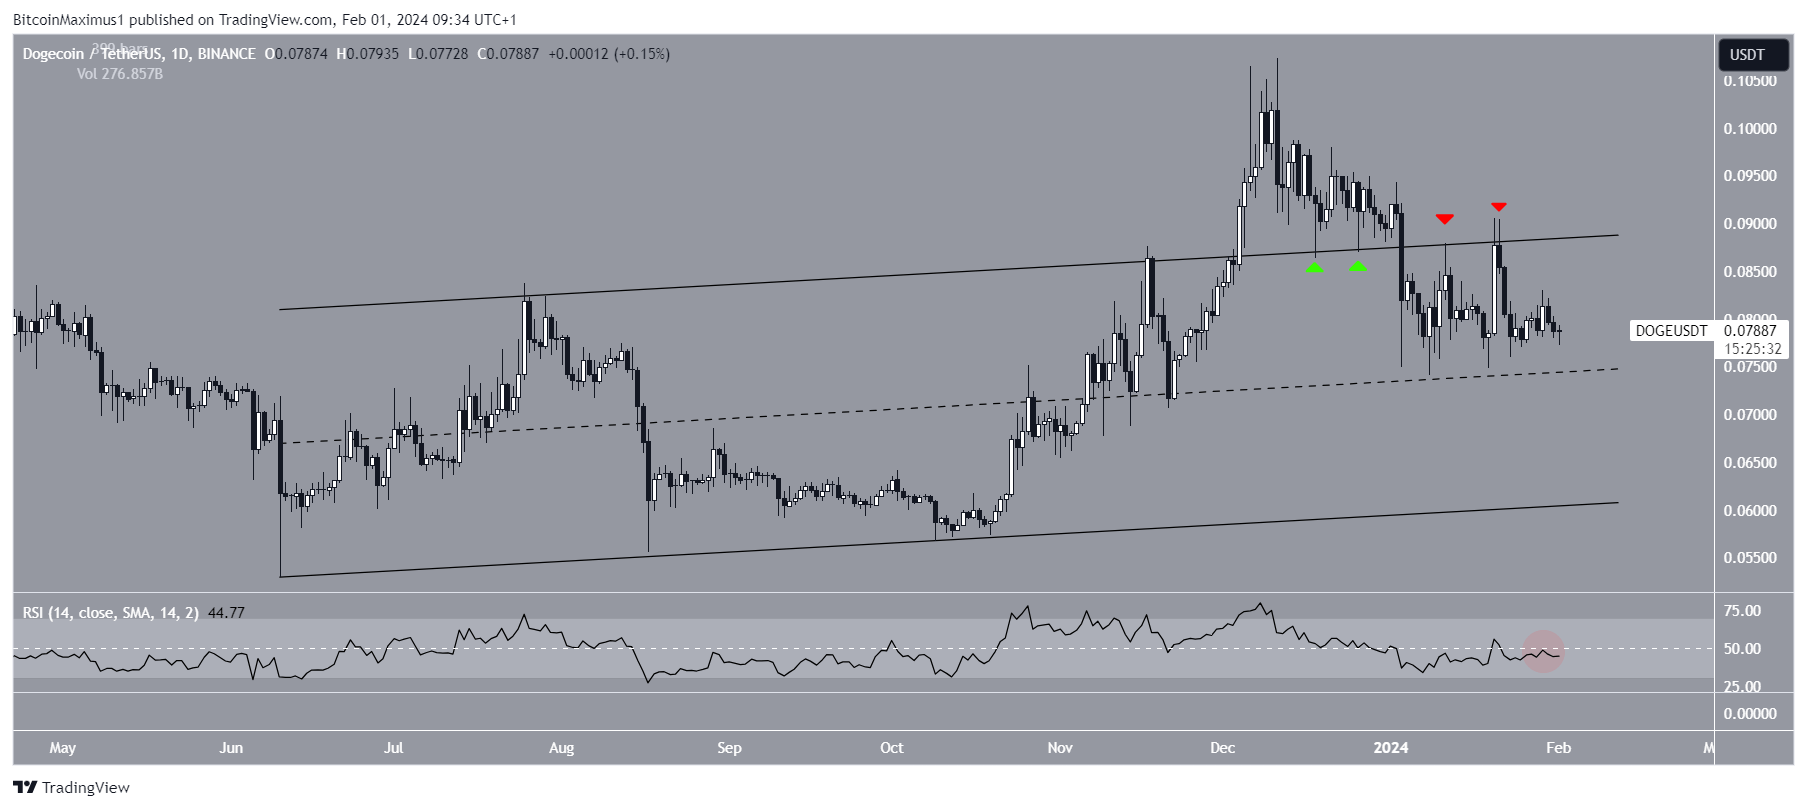
The daily time frame analysis reveals a downward trajectory in DOGE’s price since its peak at $0.107 on December 11, 2023. This decline occurred within the confines of an ascending parallel channel that had been in place since June 2023.
Análisis técnico de Dogecoin (DOGE) El análisis del marco temporal diario revela una trayectoria descendente en el precio de DOGE desde su máximo de 0,107 dólares el 11 de diciembre de 2023. Esta disminución se produjo dentro de los límites de un canal paralelo ascendente que había estado vigente desde junio de 2023.
Although Dogecoin experienced a rebound at the midline of this pattern, it faced rejection twice at the resistance trend line, marked by red icons on January 11 and 21, 2024, respectively. Currently, DOGE is trading near the midline of the channel.
Aunque Dogecoin experimentó un rebote en la línea media de este patrón, enfrentó el rechazo dos veces en la línea de tendencia de resistencia, marcada por íconos rojos el 11 y 21 de enero de 2024, respectivamente. Actualmente, DOGE cotiza cerca de la línea media del canal.

DOGE/USDT Daily Chart. Source: TradingView
Gráfico diario DOGE/USDT. Fuente: TradingView
In terms of momentum, the daily Relative Strength Index (RSI) provides a bearish indication. The RSI, a key momentum indicator used by traders to assess market conditions, suggests whether an asset is overbought or oversold, informing decisions to buy or sell.
En términos de impulso, el índice de fuerza relativa (RSI) diario proporciona una indicación bajista. El RSI, un indicador de impulso clave utilizado por los operadores para evaluar las condiciones del mercado, sugiere si un activo está sobrecomprado o sobrevendido, informando las decisiones de compra o venta.
Cryptos Headlines Platform Has Launched Its Native Token's Airdrop for the Public Join Airdrop Now
La plataforma Cryptos Headlines ha lanzado el lanzamiento aéreo de su token nativo para el público Únase al lanzamiento aéreo ahora

With readings above 50 and an upward trend indicating a bullish market sentiment, readings below 50 signal the opposite. Presently, the RSI sits below 50 (highlighted by a red circle), indicative of a bearish trend in DOGE’s price.
Con lecturas superiores a 50 y una tendencia alcista que indica un sentimiento alcista del mercado, lecturas inferiores a 50 indican lo contrario. Actualmente, el RSI se sitúa por debajo de 50 (resaltado por un círculo rojo), lo que indica una tendencia bajista en el precio de DOGE.
Also Read: Ripple Co-Founder: Hold XRP; Avoid Selling Below $10000
Lea también: Cofundador de Ripple: Mantenga XRP; Evite vender por debajo de $10000
Dogecoin (DOGE) Six-Hour Time Frame Analysis
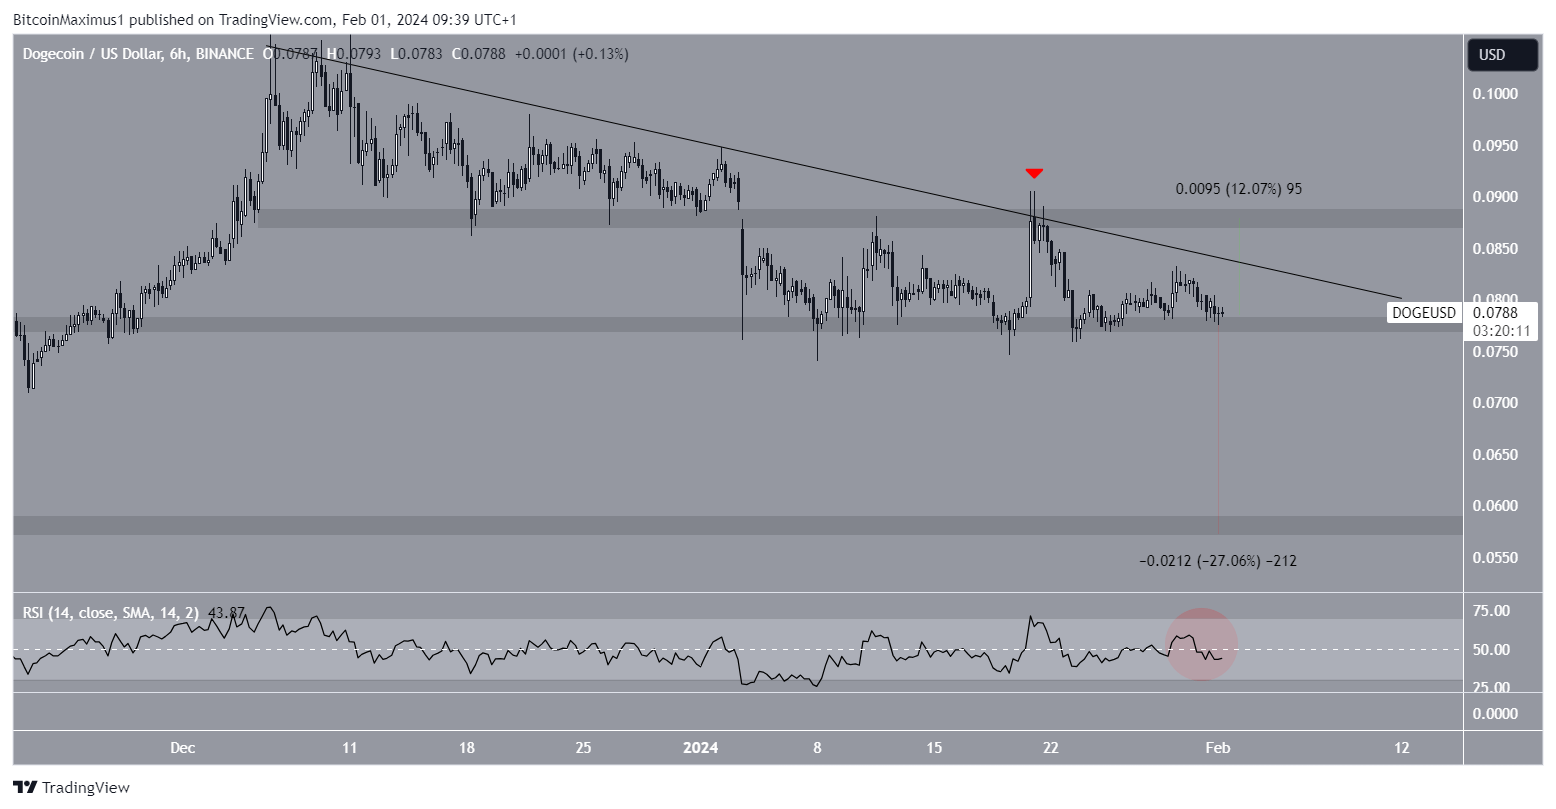
On the six-hour time frame, Dogecoin (DOGE) has been tracking beneath a descending resistance trend line since December 2023. This trend line, coupled with the $0.077 horizontal support level, has formed a descending triangle pattern, typically considered bearish.
Análisis del marco temporal de seis horas de Dogecoin (DOGE) En el marco temporal de seis horas, Dogecoin (DOGE) ha estado siguiendo por debajo de una línea de tendencia de resistencia descendente desde diciembre de 2023. Esta línea de tendencia, junto con el nivel de soporte horizontal de $ 0,077, ha formado una línea de tendencia descendente. patrón de triángulo, típicamente considerado bajista.
Cryptos Headlines Platform Has Launched Its Native Token's Airdrop for the Public Join Airdrop Now
La plataforma Cryptos Headlines ha lanzado el lanzamiento aéreo de su token nativo para el público Únase al lanzamiento aéreo ahora

Currently, DOGE hovers just above this crucial support area, while the Relative Strength Index (RSI) has dipped below the 50 mark (indicated by a red circle). A breakdown below this support level could potentially lead to a significant 27% decline, targeting the nearest support at $0.057.
Actualmente, DOGE se sitúa justo por encima de esta área de soporte crucial, mientras que el índice de fuerza relativa (RSI) ha caído por debajo de la marca 50 (indicada por un círculo rojo). Una caída por debajo de este nivel de soporte podría conducir potencialmente a una caída significativa del 27%, apuntando al soporte más cercano en $0,057.

DOGE/USDT Six-Hour Chart. Source: TradingView
Gráfico de seis horas DOGE/USDT. Fuente: TradingView
However, despite the bearish outlook, a robust rebound from the $0.077 support zone could catalyze a breakout from the resistance trend line. This breakout scenario could prompt a 12% upswing, aiming for the next resistance level at $0.087.
Sin embargo, a pesar de la perspectiva bajista, un fuerte rebote desde la zona de soporte de $0,077 podría catalizar una ruptura de la línea de tendencia de resistencia. Este escenario de ruptura podría provocar un repunte del 12%, apuntando al siguiente nivel de resistencia en 0,087$.
Important: Please note that this article is only meant to provide information and should not be taken as legal, tax, investment, financial, or any other type of advice.
Importante: Tenga en cuenta que este artículo solo pretende proporcionar información y no debe tomarse como asesoramiento legal, fiscal, de inversión, financiero ni de ningún otro tipo.


 Crypto Intelligence
 BlockchainReporter
 CFN
CFN Crypto News Land
 Crypto News Land
 Crypto Intelligence
 DeFi Planet
 TheCoinrise Media
 TheCoinrise Media


