

Dogecoin (DOGE) has maintained its position near the $0.077 horizontal support level since the year began. Analysis of both daily and six-hour time frames, along with RSI readings, suggests a potential downtrend in DOGE’s price. Nevertheless, breaching the resistance trendline might trigger a rebound, defying bearish expectations.
自今年年初以來,狗狗幣 (DOGE) 一直維持在 0.077 美元水平支撐位附近。對每日和六小時時間框架以及 RSI 讀數的分析顯示 DOGE 價格存在潛在下降趨勢。然而,突破阻力趨勢線可能會引發反彈,打破悲觀預期。

Cryptos Headlines Platform Has Launched Its Native Token's Airdrop for the Public Join Airdrop Now
Cryptos Headlines平台已向公眾推出其原生代幣空投 立即加入空投
DOGE price is currently trading within a long-term corrective pattern and a short-term bearish trend. It has revisited a horizontal support zone established since the beginning of the year. The critical question remains: will it bounce off this support level or break down?
DOGE 價格目前處於長期調整模式和短期看跌趨勢。它重新審視了今年年初以來建立的水平支撐區。關鍵問題仍然是:它會從該支撐位反彈還是崩潰?
Dogecoin (DOGE) Technical Analysis
The daily time frame analysis reveals a downward trajectory in DOGE’s price since its peak at $0.107 on December 11, 2023. This decline occurred within the confines of an ascending parallel channel that had been in place since June 2023.
狗狗幣(DOGE) 技術分析每日時間框架分析顯示,DOGE 的價格自2023 年12 月11 日達到高峰0.107 美元以來一直呈下降趨勢。這種下跌發生在自2023 年6 月以來一直存在的上升平行通道的範圍內。
Although Dogecoin experienced a rebound at the midline of this pattern, it faced rejection twice at the resistance trend line, marked by red icons on January 11 and 21, 2024, respectively. Currently, DOGE is trading near the midline of the channel.
儘管狗狗幣在該形態的中線經歷了反彈,但它在阻力趨勢線處兩次遭遇拒絕,分別於2024年1月11日和21日以紅色圖標為標誌。目前,DOGE 交易於通道中線附近。
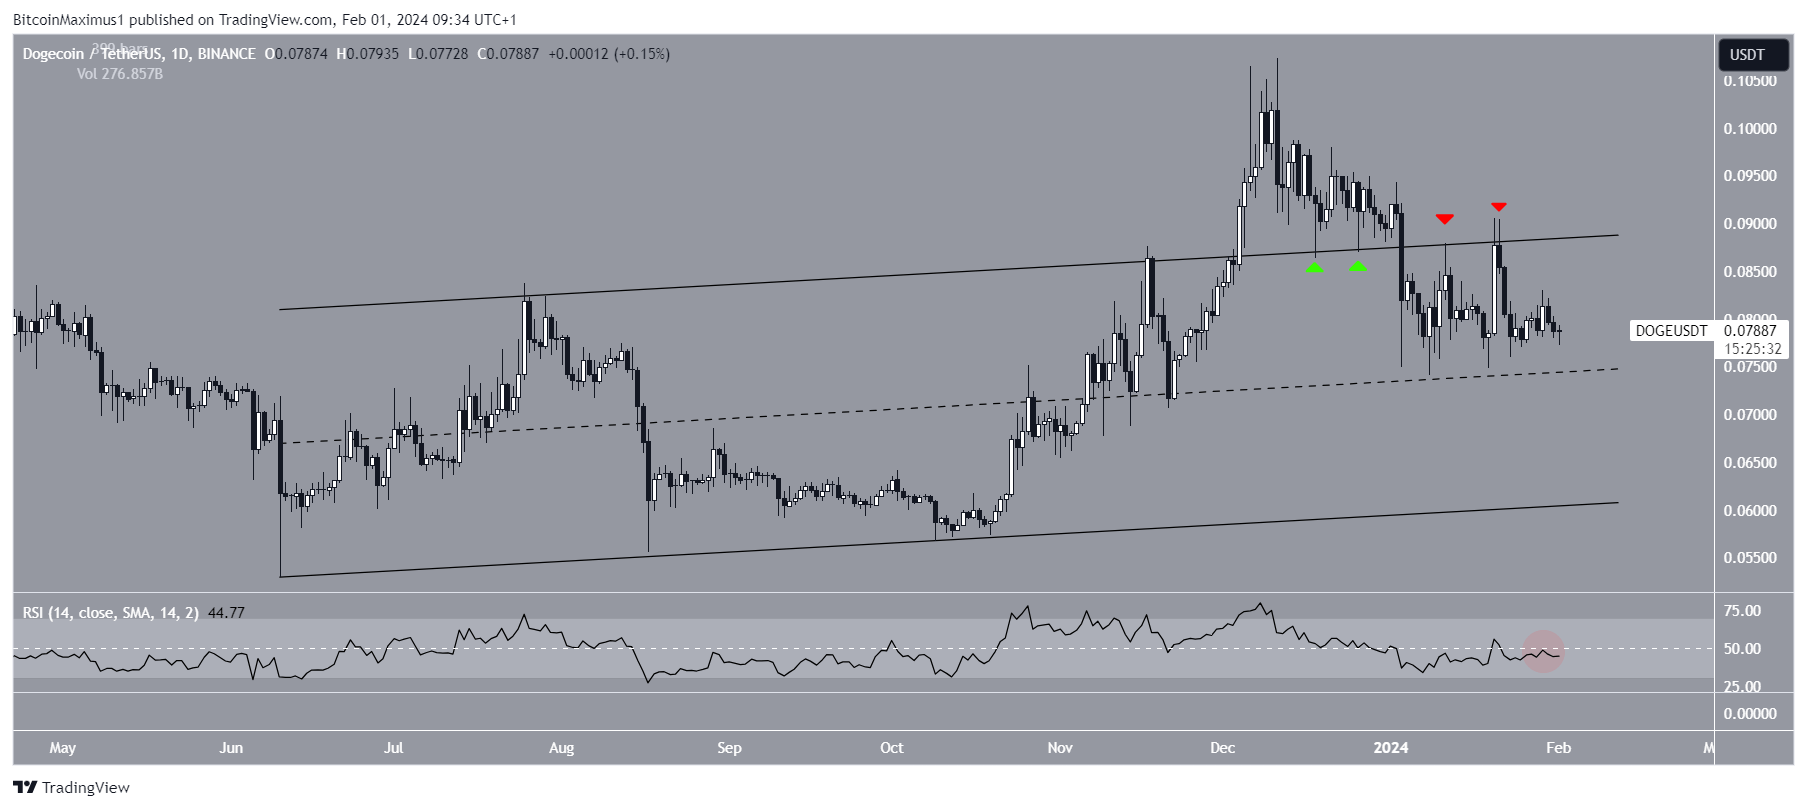
DOGE/USDT Daily Chart. Source: TradingView
DOGE/USDT 每日圖表。來源:TradingView
In terms of momentum, the daily Relative Strength Index (RSI) provides a bearish indication. The RSI, a key momentum indicator used by traders to assess market conditions, suggests whether an asset is overbought or oversold, informing decisions to buy or sell.
就動能而言,每日相對強度指數(RSI)提供了看跌跡象。 RSI 是交易者用來評估市場狀況的關鍵動量指標,它表明資產是否超買或超賣,為買入或賣出決策提供資訊。
Cryptos Headlines Platform Has Launched Its Native Token's Airdrop for the Public Join Airdrop Now
Cryptos Headlines平台已向公眾推出其原生代幣空投 立即加入空投
With readings above 50 and an upward trend indicating a bullish market sentiment, readings below 50 signal the opposite. Presently, the RSI sits below 50 (highlighted by a red circle), indicative of a bearish trend in DOGE’s price.
讀數高於 50 且上升趨勢表示市場情緒看漲,讀數低於 50 則表示相反的情況。目前,RSI 低於 50(以紅色圓圈突出顯示),表明 DOGE 價格呈現看跌趨勢。
Also Read: Ripple Co-Founder: Hold XRP; Avoid Selling Below $10000
另請閱讀:Ripple 聯合創始人:持有 XRP;避免售價低於 10000 美元
Dogecoin (DOGE) Six-Hour Time Frame Analysis
On the six-hour time frame, Dogecoin (DOGE) has been tracking beneath a descending resistance trend line since December 2023. This trend line, coupled with the $0.077 horizontal support level, has formed a descending triangle pattern, typically considered bearish.
狗狗幣(DOGE)六小時時間框架分析在六小時時間框架上,狗狗幣(DOGE)自2023 年12 月以來一直在下降阻力趨勢線下方追踪。這條趨勢線與0.077 美元的水平支撐位相結合,形成了下降趨勢線。三角形形態,通常被視為看跌。
Cryptos Headlines Platform Has Launched Its Native Token's Airdrop for the Public Join Airdrop Now
Cryptos Headlines平台已向公眾推出其原生代幣空投 立即加入空投
Currently, DOGE hovers just above this crucial support area, while the Relative Strength Index (RSI) has dipped below the 50 mark (indicated by a red circle). A breakdown below this support level could potentially lead to a significant 27% decline, targeting the nearest support at $0.057.
目前,DOGE 徘徊在這一關鍵支撐區域上方,而相對強弱指數 (RSI) 已跌破 50 關卡(以紅色圓圈表示)。跌破該支撐位可能會導致大幅下跌 27%,最近的支撐位為 0.057 美元。
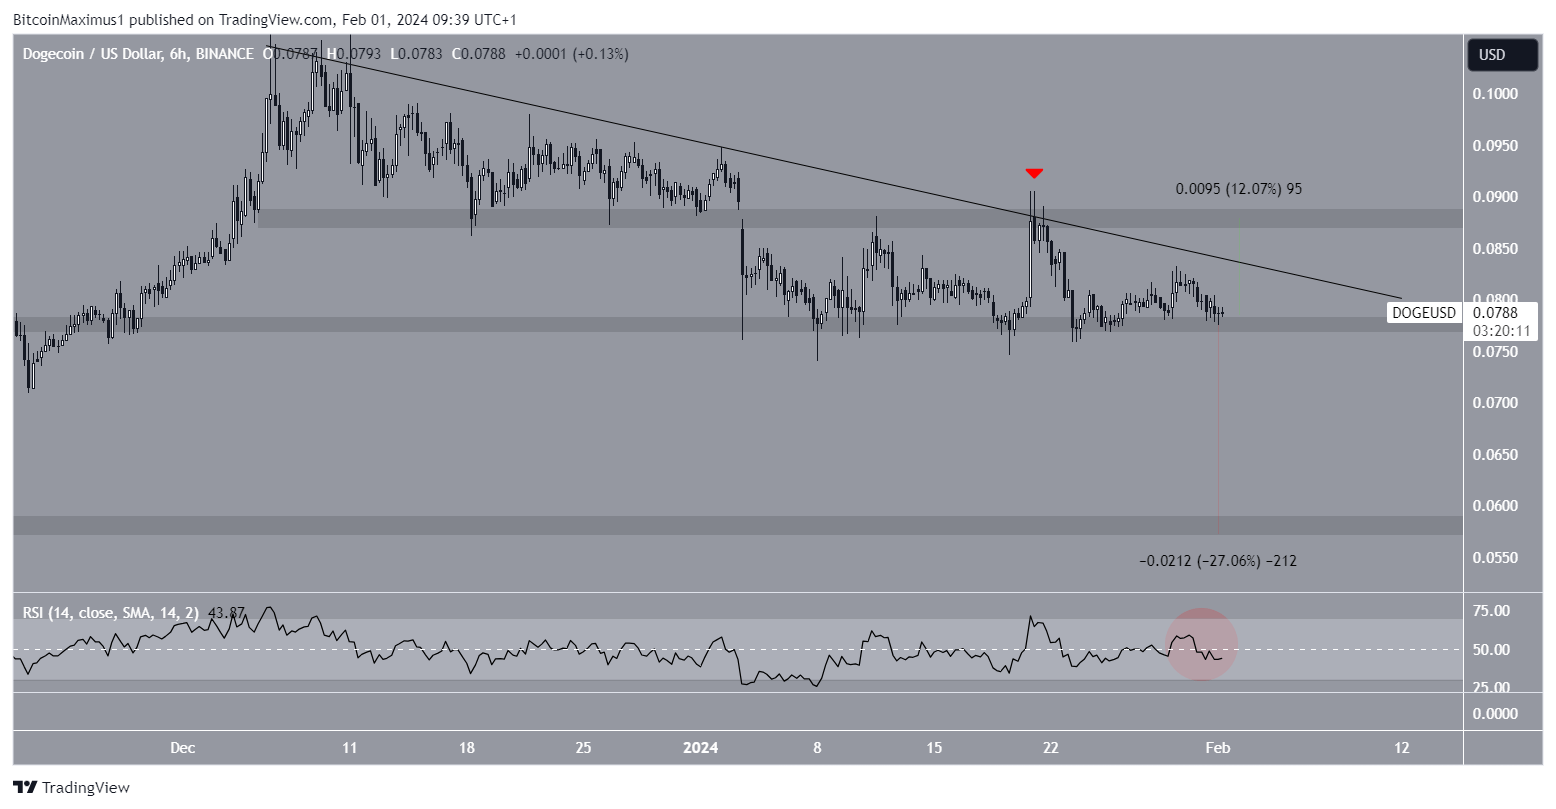
DOGE/USDT Six-Hour Chart. Source: TradingView
DOGE/USDT 六小時圖。來源:TradingView
However, despite the bearish outlook, a robust rebound from the $0.077 support zone could catalyze a breakout from the resistance trend line. This breakout scenario could prompt a 12% upswing, aiming for the next resistance level at $0.087.
然而,儘管前景看跌,但從 0.077 美元支撐區的強勁反彈可能會促使突破阻力趨勢線。這種突破情境可能會促使物價上漲 12%,目標是下一個阻力位 0.087 美元。
Important: Please note that this article is only meant to provide information and should not be taken as legal, tax, investment, financial, or any other type of advice.
重要提示:請注意,本文僅旨在提供信息,不應被視為法律、稅務、投資、財務或任何其他類型的建議。
 DeFi Planet
 Crypto Daily™
 BlockchainReporter
 TheCoinrise Media
 DogeHome
 Crypto Daily™
 Crypto Daily™
 TheCoinrise Media


